Search Results: "vincent"

22 April 2024

Vincent Fourmond: QSoas version 3.3 is out

Version 3.3 brings in new features, including reverse Laplace transforms and fits, pH fits, commands for picking points from a dataset, averaging points with the same X value, or perform singular value decomposition. In addition to these new features, many previous commands were improved, like the addition of a bandcut filter in FFT filtering, better handling of the loading of files produced by QSoas itself, and a button to interrupt the processing of scripts. There are a lot of other new features, improvements and so on, look for the full list there. About QSoas
QSoas is a powerful open source data analysis program that focuses on flexibility and powerful fitting capacities. It is released under the GNU General Public License. It is described in Fourmond, Anal. Chem., 2016, 88 (10), pp 5050 5052. Current version is 3.3. You can download for free its source code or precompiled versions for MacOS and Windows there. Alternatively, you can clone from the GitHub repository.

5 November 2023

Vincent Bernat: Non-interactive SSH password authentication

SSH offers several forms of authentication, such as passwords and public keys. The latter are considered more secure. However, password authentication remains prevalent, particularly with network equipment.1 A classic solution to avoid typing a password for each connection is sshpass, or its more correct variant passh. Here is a wrapper for Zsh, getting the password from pass, a simple password manager:2
pssh()  
  passh -p <(pass show network/ssh/password   head -1) ssh "$@"
 
compdef pssh=ssh
This approach is a bit brittle as it requires to parse the output of the ssh command to look for a password prompt. Moreover, if no password is required, the password manager is still invoked. Since OpenSSH 8.4, we can use SSH_ASKPASS and SSH_ASKPASS_REQUIRE instead:
ssh()  
  set -o localoptions -o localtraps
  local passname=network/ssh/password
  local helper=$(mktemp)
  trap "command rm -f $helper" EXIT INT
  > $helper <<EOF
#!$SHELL
pass show $passname   head -1
EOF
  chmod u+x $helper
  SSH_ASKPASS=$helper SSH_ASKPASS_REQUIRE=force command ssh "$@"
 
If the password is incorrect, we can display a prompt on the second tentative:
ssh()  
  set -o localoptions -o localtraps
  local passname=network/ssh/password
  local helper=$(mktemp)
  trap "command rm -f $helper" EXIT INT
  > $helper <<EOF
#!$SHELL
if [ -k $helper ]; then
   
    oldtty=\$(stty -g)
    trap 'stty \$oldtty < /dev/tty 2> /dev/null' EXIT INT TERM HUP
    stty -echo
    print "\rpassword: "
    read password
    printf "\n"
    > /dev/tty < /dev/tty
  printf "%s" "\$password"
else
  pass show $passname   head -1
  chmod +t $helper
fi
EOF
  chmod u+x $helper
  SSH_ASKPASS=$helper SSH_ASKPASS_REQUIRE=force command ssh "$@"
 
A possible improvement is to use a different password entry depending on the remote host:3
ssh()  
  # Grab login information
  local -A details
  details=($ =$ (M)$ :-"$ (@f)$(command ssh -G "$@" 2>/dev/null) " :#(host hostname user) * )
  local remote=$ details[host]:-details[hostname] 
  local login=$ details[user] @$ remote 
  # Get password name
  local passname
  case "$login" in
    admin@*.example.net)  passname=company1/ssh/admin ;;
    bernat@*.example.net) passname=company1/ssh/bernat ;;
    backup@*.example.net) passname=company1/ssh/backup ;;
  esac
  # No password name? Just use regular SSH
  [[ -z $passname ]] &&  
    command ssh "$@"
    return $?
   
  # Invoke SSH with the helper for SSH_ASKPASS
  # [ ]
 
It is also possible to make scp invoke our custom ssh function:
scp()  
  set -o localoptions -o localtraps
  local helper=$(mktemp)
  trap "command rm -f $helper" EXIT INT
  > $helper <<EOF 
#!$SHELL
source $ (%):-%x 
ssh "\$@"
EOF
  command scp -S $helper "$@"
 
For the complete code, have a look at my zshrc. As an alternative, you can put the ssh() function body into its own script file and replace command ssh with /usr/bin/ssh to avoid an unwanted recursive call. In this case, the scp() function is not needed anymore.

  1. First, some vendors make it difficult to associate an SSH key with a user. Then, many vendors do not support certificate-based authentication, making it difficult to scale. Finally, interactions between public-key authentication and finer-grained authorization methods like TACACS+ and Radius are still uncharted territory.
  2. The clear-text password never appears on the command line, in the environment, or on the disk, making it difficult for a third party without elevated privileges to capture it. On Linux, Zsh provides the password through a file descriptor.
  3. To decipher the fourth line, you may get help from print -l and the zshexpn(1) manual page. details is an associative array defined from an array alternating keys and values.

8 September 2023

Reproducible Builds: Reproducible Builds in August 2023

Welcome to the August 2023 report from the Reproducible Builds project! In these reports we outline the most important things that we have been up to over the past month. As a quick recap, whilst anyone may inspect the source code of free software for malicious flaws, almost all software is distributed to end users as pre-compiled binaries. The motivation behind the reproducible builds effort is to ensure no flaws have been introduced during this compilation process by promising identical results are always generated from a given source, thus allowing multiple third-parties to come to a consensus on whether a build was compromised. If you are interested in contributing to the project, please visit our Contribute page on our website.

Rust serialisation library moving to precompiled binaries Bleeping Computer reported that Serde, a popular Rust serialization framework, had decided to ship its serde_derive macro as a precompiled binary. As Ax Sharma writes:
The move has generated a fair amount of push back among developers who worry about its future legal and technical implications, along with a potential for supply chain attacks, should the maintainer account publishing these binaries be compromised.
After intensive discussions, use of the precompiled binary was phased out.

Reproducible builds, the first ten years On August 4th, Holger Levsen gave a talk at BornHack 2023 on the Danish island of Funen titled Reproducible Builds, the first ten years which promised to contain:
[ ] an overview about reproducible builds, the past, the presence and the future. How it started with a small [meeting] at DebConf13 (and before), how it grew from being a Debian effort to something many projects work on together, until in 2021 it was mentioned in an executive order of the president of the United States. (HTML slides)
Holger repeated the talk later in the month at Chaos Communication Camp 2023 in Zehdenick, Germany: A video of the talk is available online, as are the HTML slides.

Reproducible Builds Summit Just another reminder that our upcoming Reproducible Builds Summit is set to take place from October 31st November 2nd 2023 in Hamburg, Germany. Our summits are a unique gathering that brings together attendees from diverse projects, united by a shared vision of advancing the Reproducible Builds effort. During this enriching event, participants will have the opportunity to engage in discussions, establish connections and exchange ideas to drive progress in this vital field. If you re interested in joining us this year, please make sure to read the event page, the news item, or the invitation email that Mattia Rizzolo sent out, which have more details about the event and location. We are also still looking for sponsors to support the event, so do reach out to the organizing team if you are able to help. (Also of note that PackagingCon 2023 is taking place in Berlin just before our summit, and their schedule has just been published.)

Vagrant Cascadian on the Sustain podcast Vagrant Cascadian was interviewed on the SustainOSS podcast on reproducible builds:
Vagrant walks us through his role in the project where the aim is to ensure identical results in software builds across various machines and times, enhancing software security and creating a seamless developer experience. Discover how this mission, supported by the Software Freedom Conservancy and a broad community, is changing the face of Linux distros, Arch Linux, openSUSE, and F-Droid. They also explore the challenges of managing random elements in software, and Vagrant s vision to make reproducible builds a standard best practice that will ideally become automatic for users. Vagrant shares his work in progress and their commitment to the last mile problem.
The episode is available to listen (or download) from the Sustain podcast website. As it happens, the episode was recorded at FOSSY 2023, and the video of Vagrant s talk from this conference (Breaking the Chains of Trusting Trust is now available on Archive.org: It was also announced that Vagrant Cascadian will be presenting at the Open Source Firmware Conference in October on the topic of Reproducible Builds All The Way Down.

On our mailing list Carles Pina i Estany wrote to our mailing list during August with an interesting question concerning the practical steps to reproduce the hello-traditional package from Debian. The entire thread can be viewed from the archive page, as can Vagrant Cascadian s reply.

Website updates Rahul Bajaj updated our website to add a series of environment variations related to reproducible builds [ ], Russ Cox added the Go programming language to our projects page [ ] and Vagrant Cascadian fixed a number of broken links and typos around the website [ ][ ][ ].

Software development In diffoscope development this month, versions 247, 248 and 249 were uploaded to Debian unstable by Chris Lamb, who also added documentation for the new specialize_as method and expanding the documentation of the existing specialize as well [ ]. In addition, Fay Stegerman added specialize_as and used it to optimise .smali comparisons when decompiling Android .apk files [ ], Felix Yan and Mattia Rizzolo corrected some typos in code comments [ , ], Greg Chabala merged the RUN commands into single layer in the package s Dockerfile [ ] thus greatly reducing the final image size. Lastly, Roland Clobus updated tool descriptions to mark that the xb-tool has moved package within Debian [ ].
reprotest is our tool for building the same source code twice in different environments and then checking the binaries produced by each build for any differences. This month, Vagrant Cascadian updated the packaging to be compatible with Tox version 4. This was originally filed as Debian bug #1042918 and Holger Levsen uploaded this to change to Debian unstable as version 0.7.26 [ ].

Distribution work In Debian, 28 reviews of Debian packages were added, 14 were updated and 13 were removed this month adding to our knowledge about identified issues. A number of issue types were added, including Chris Lamb adding a new timestamp_in_documentation_using_sphinx_zzzeeksphinx_theme toolchain issue.
In August, F-Droid added 25 new reproducible apps and saw 2 existing apps switch to reproducible builds, making 191 apps in total that are published with Reproducible Builds and using the upstream developer s signature. [ ]
Bernhard M. Wiedemann published another monthly report about reproducibility within openSUSE.

Upstream patches The Reproducible Builds project detects, dissects and attempts to fix as many currently-unreproducible packages as possible. We endeavour to send all of our patches upstream where appropriate. This month, we wrote a large number of such patches, including:

Testing framework The Reproducible Builds project operates a comprehensive testing framework (available at tests.reproducible-builds.org) in order to check packages and other artifacts for reproducibility. In August, a number of changes were made by Holger Levsen:
  • Debian-related changes:
    • Disable Debian live image creation jobs until an OpenQA credential problem has been fixed. [ ]
    • Run our maintenance scripts every 3 hours instead of every 2. [ ]
    • Export data for unstable to the reproducible-tracker.json data file. [ ]
    • Stop varying the build path, we want reproducible builds. [ ]
    • Temporarily stop updating the pbuilder.tgz for Debian unstable due to #1050784. [ ][ ]
    • Correctly document that we are not variying usrmerge. [ ][ ]
    • Mark two armhf nodes (wbq0 and jtx1a) as down; investigation is needed. [ ]
  • Misc:
    • Force reconfiguration of all Jenkins jobs, due to the recent rise of zombie processes. [ ]
    • In the node health checks, also try to restart failed ntpsec, postfix and vnstat services. [ ][ ][ ]
  • System health checks:
    • Detect Debian live build failures due to missing credentials. [ ][ ]
    • Ignore specific types of known zombie processes. [ ][ ]
In addition, Vagrant Cascadian updated the scripts to use a predictable build path that is consistent with the one used on buildd.debian.org. [ ][ ]

If you are interested in contributing to the Reproducible Builds project, please visit our Contribute page on our website. However, you can get in touch with us via:

27 March 2023

Vincent Fourmond: QSoas version 3.2 is out

Version 3.2 of QSoas is out ! It is mostly a bug-fix release, fixing the computation mistake found in the eecr-relay wave shape fit, see the correction to our initial article in JACS. We strongly encourage all the users of the eecr-relay wave shape fit to upgrade, and, unfortunately, refit previously fitted data as the results might change. The other wave shape fits are not affected by the issue. New features In addition to this important bug fix, new possibilities have been added, including a way to make fits with partially global parameters using the new define-indexed-fit command, to pick the best parameters dataset-by-dataset within fit trajectories, but also a parameter space explorer trying all possible permutations of one or more sets of parameters, and the possibility to save the results of a command to a global ruby variable. There are a lot of other new features, improvements and so on, look for the full list there. About QSoas
QSoas is a powerful open source data analysis program that focuses on flexibility and powerful fitting capacities. It is released under the GNU General Public License. It is described in Fourmond, Anal. Chem., 2016, 88 (10), pp 5050 5052. Current version is 3.2. You can download for free its source code or precompiled versions for MacOS and Windows there. Alternatively, you can clone from the GitHub repository.

6 March 2023

Vincent Bernat: DDoS detection and remediation with Akvorado and Flowspec

Akvorado collects sFlow and IPFIX flows, stores them in a ClickHouse database, and presents them in a web console. Although it lacks built-in DDoS detection, it s possible to create one by crafting custom ClickHouse queries.

DDoS detection Let s assume we want to detect DDoS targeting our customers. As an example, we consider a DDoS attack as a collection of flows over one minute targeting a single customer IP address, from a single source port and matching one of these conditions:
  • an average bandwidth of 1 Gbps,
  • an average bandwidth of 200 Mbps when the protocol is UDP,
  • more than 20 source IP addresses and an average bandwidth of 100 Mbps, or
  • more than 10 source countries and an average bandwidth of 100 Mbps.
Here is the SQL query to detect such attacks over the last 5 minutes:
SELECT *
FROM (
  SELECT
    toStartOfMinute(TimeReceived) AS TimeReceived,
    DstAddr,
    SrcPort,
    dictGetOrDefault('protocols', 'name', Proto, '???') AS Proto,
    SUM(((((Bytes * SamplingRate) * 8) / 1000) / 1000) / 1000) / 60 AS Gbps,
    uniq(SrcAddr) AS sources,
    uniq(SrcCountry) AS countries
  FROM flows
  WHERE TimeReceived > now() - INTERVAL 5 MINUTE
    AND DstNetRole = 'customers'
  GROUP BY
    TimeReceived,
    DstAddr,
    SrcPort,
    Proto
)
WHERE (Gbps > 1)
   OR ((Proto = 'UDP') AND (Gbps > 0.2)) 
   OR ((sources > 20) AND (Gbps > 0.1)) 
   OR ((countries > 10) AND (Gbps > 0.1))
ORDER BY
  TimeReceived DESC,
  Gbps DESC
Here is an example output1 where two of our users are under attack. One from what looks like an NTP amplification attack, the other from a DNS amplification attack:
TimeReceived DstAddr SrcPort Proto Gbps sources countries
2023-02-26 17:44:00 ::ffff:203.0.113.206 123 UDP 0.102 109 13
2023-02-26 17:43:00 ::ffff:203.0.113.206 123 UDP 0.130 133 17
2023-02-26 17:43:00 ::ffff:203.0.113.68 53 UDP 0.129 364 63
2023-02-26 17:43:00 ::ffff:203.0.113.206 123 UDP 0.113 129 21
2023-02-26 17:42:00 ::ffff:203.0.113.206 123 UDP 0.139 50 14
2023-02-26 17:42:00 ::ffff:203.0.113.206 123 UDP 0.105 42 14
2023-02-26 17:40:00 ::ffff:203.0.113.68 53 UDP 0.121 340 65

DDoS remediation Once detected, there are at least two ways to stop the attack at the network level:
  • blackhole the traffic to the targeted user (RTBH), or
  • selectively drop packets matching the attack patterns (Flowspec).

Traffic blackhole The easiest method is to sacrifice the attacked user. While this helps the attacker, this protects your network. It is a method supported by all routers. You can also offload this protection to many transit providers. This is useful if the attack volume exceeds your internet capacity. This works by advertising with BGP a route to the attacked user with a specific community. The border router modifies the next hop address of these routes to a specific IP address configured to forward the traffic to a null interface. RFC 7999 defines 65535:666 for this purpose. This is known as a remote-triggered blackhole (RTBH) and is explained in more detail in RFC 3882. It is also possible to blackhole the source of the attacks by leveraging unicast Reverse Path Forwarding (uRPF) from RFC 3704, as explained in RFC 5635. However, uRPF can be a serious tax on your router resources. See NCS5500 uRPF: Configuration and Impact on Scale for an example of the kind of restrictions you have to expect when enabling uRPF. On the advertising side, we can use BIRD. Here is a complete configuration file to allow any router to collect them:
log stderr all;
router id 192.0.2.1;
protocol device  
  scan time 10;
 
protocol bgp exporter  
  ipv4  
    import none;
    export where proto = "blackhole4";
   ;
  ipv6  
    import none;
    export where proto = "blackhole6";
   ;
  local as 64666;
  neighbor range 192.0.2.0/24 external;
  multihop;
  dynamic name "exporter";
  dynamic name digits 2;
  graceful restart yes;
  graceful restart time 0;
  long lived graceful restart yes;
  long lived stale time 3600;  # keep routes for 1 hour!
 
protocol static blackhole4  
  ipv4;
  route 203.0.113.206/32 blackhole  
    bgp_community.add((65535, 666));
   ;
  route 203.0.113.68/32 blackhole  
    bgp_community.add((65535, 666));
   ;
 
protocol static blackhole6  
  ipv6;
 
We use BGP long-lived graceful restart to ensure routes are kept for one hour, even if the BGP connection goes down, notably during maintenance. On the receiver side, if you have a Cisco router running IOS XR, you can use the following configuration to blackhole traffic received on the BGP session. As the BGP session is dedicated to this usage, The community is not used, but you can also forward these routes to your transit providers.
router static
 vrf public
  address-family ipv4 unicast
   192.0.2.1/32 Null0 description "BGP blackhole"
  !
  address-family ipv6 unicast
   2001:db8::1/128 Null0 description "BGP blackhole"
  !
 !
!
route-policy blackhole_ipv4_in_public
  if destination in (0.0.0.0/0 le 31) then
    drop
  endif
  set next-hop 192.0.2.1
  done
end-policy
!
route-policy blackhole_ipv6_in_public
  if destination in (::/0 le 127) then
    drop
  endif
  set next-hop 2001:db8::1
  done
end-policy
!
router bgp 12322
 neighbor-group BLACKHOLE_IPV4_PUBLIC
  remote-as 64666
  ebgp-multihop 255
  update-source Loopback10
  address-family ipv4 unicast
   maximum-prefix 100 90
   route-policy blackhole_ipv4_in_public in
   route-policy drop out
   long-lived-graceful-restart stale-time send 86400 accept 86400
  !
  address-family ipv6 unicast
   maximum-prefix 100 90
   route-policy blackhole_ipv6_in_public in
   route-policy drop out
   long-lived-graceful-restart stale-time send 86400 accept 86400
  !
 !
 vrf public
  neighbor 192.0.2.1
   use neighbor-group BLACKHOLE_IPV4_PUBLIC
   description akvorado-1
When the traffic is blackholed, it is still reported by IPFIX and sFlow. In Akvorado, use ForwardingStatus >= 128 as a filter. While this method is compatible with all routers, it makes the attack successful as the target is completely unreachable. If your router supports it, Flowspec can selectively filter flows to stop the attack without impacting the customer.

Flowspec Flowspec is defined in RFC 8955 and enables the transmission of flow specifications in BGP sessions. A flow specification is a set of matching criteria to apply to IP traffic. These criteria include the source and destination prefix, the IP protocol, the source and destination port, and the packet length. Each flow specification is associated with an action, encoded as an extended community: traffic shaping, traffic marking, or redirection. To announce flow specifications with BIRD, we extend our configuration. The extended community used shapes the matching traffic to 0 bytes per second.
flow4 table flowtab4;
flow6 table flowtab6;
protocol bgp exporter  
  flow4  
    import none;
    export where proto = "flowspec4";
   ;
  flow6  
    import none;
    export where proto = "flowspec6";
   ;
  # [ ]
 
protocol static flowspec4  
  flow4;
  route flow4  
    dst 203.0.113.68/32;
    sport = 53;
    length >= 1476 && <= 1500;
    proto = 17;
   
    bgp_ext_community.add((generic, 0x80060000, 0x00000000));
   ;
  route flow4  
    dst 203.0.113.206/32;
    sport = 123;
    length = 468;
    proto = 17;
   
    bgp_ext_community.add((generic, 0x80060000, 0x00000000));
   ;
 
protocol static flowspec6  
  flow6;
 
If you have a Cisco router running IOS XR, the configuration may look like this:
vrf public
 address-family ipv4 flowspec
 address-family ipv6 flowspec
!
router bgp 12322
 address-family vpnv4 flowspec
 address-family vpnv6 flowspec
 neighbor-group FLOWSPEC_IPV4_PUBLIC
  remote-as 64666
  ebgp-multihop 255
  update-source Loopback10
  address-family ipv4 flowspec
   long-lived-graceful-restart stale-time send 86400 accept 86400
   route-policy accept in
   route-policy drop out
   maximum-prefix 100 90
   validation disable
  !
  address-family ipv6 flowspec
   long-lived-graceful-restart stale-time send 86400 accept 86400
   route-policy accept in
   route-policy drop out
   maximum-prefix 100 90
   validation disable
  !
 !
 vrf public
  address-family ipv4 flowspec
  address-family ipv6 flowspec
  neighbor 192.0.2.1
   use neighbor-group FLOWSPEC_IPV4_PUBLIC
   description akvorado-1
Then, you need to enable Flowspec on all interfaces with:
flowspec
 vrf public
  address-family ipv4
   local-install interface-all
  !
  address-family ipv6
   local-install interface-all
  !
 !
!
As with the RTBH setup, you can filter dropped flows with ForwardingStatus >= 128.

DDoS detection (continued) In the example using Flowspec, the flows were also filtered on the length of the packet:
route flow4  
  dst 203.0.113.68/32;
  sport = 53;
  length >= 1476 && <= 1500;
  proto = 17;
 
  bgp_ext_community.add((generic, 0x80060000, 0x00000000));
 ;
This is an important addition: legitimate DNS requests are smaller than this and therefore not filtered.2 With ClickHouse, you can get the 10th and 90th percentiles of the packet sizes with quantiles(0.1, 0.9)(Bytes/Packets). The last issue we need to tackle is how to optimize the request: it may need several seconds to collect the data and it is likely to consume substantial resources from your ClickHouse database. One solution is to create a materialized view to pre-aggregate results:
CREATE TABLE ddos_logs (
  TimeReceived DateTime,
  DstAddr IPv6,
  Proto UInt32,
  SrcPort UInt16,
  Gbps SimpleAggregateFunction(sum, Float64),
  Mpps SimpleAggregateFunction(sum, Float64),
  sources AggregateFunction(uniqCombined(12), IPv6),
  countries AggregateFunction(uniqCombined(12), FixedString(2)),
  size AggregateFunction(quantiles(0.1, 0.9), UInt64)
) ENGINE = SummingMergeTree
PARTITION BY toStartOfHour(TimeReceived)
ORDER BY (TimeReceived, DstAddr, Proto, SrcPort)
TTL toStartOfHour(TimeReceived) + INTERVAL 6 HOUR DELETE ;
CREATE MATERIALIZED VIEW ddos_logs_view TO ddos_logs AS
  SELECT
    toStartOfMinute(TimeReceived) AS TimeReceived,
    DstAddr,
    Proto,
    SrcPort,
    sum(((((Bytes * SamplingRate) * 8) / 1000) / 1000) / 1000) / 60 AS Gbps,
    sum(((Packets * SamplingRate) / 1000) / 1000) / 60 AS Mpps,
    uniqCombinedState(12)(SrcAddr) AS sources,
    uniqCombinedState(12)(SrcCountry) AS countries,
    quantilesState(0.1, 0.9)(toUInt64(Bytes/Packets)) AS size
  FROM flows
  WHERE DstNetRole = 'customers'
  GROUP BY
    TimeReceived,
    DstAddr,
    Proto,
    SrcPort
The ddos_logs table is using the SummingMergeTree engine. When the table receives new data, ClickHouse replaces all the rows with the same sorting key, as defined by the ORDER BY directive, with one row which contains summarized values using either the sum() function or the explicitly specified aggregate function (uniqCombined and quantiles in our example).3 Finally, we can modify our initial query with the following one:
SELECT *
FROM (
  SELECT
    TimeReceived,
    DstAddr,
    dictGetOrDefault('protocols', 'name', Proto, '???') AS Proto,
    SrcPort,
    sum(Gbps) AS Gbps,
    sum(Mpps) AS Mpps,
    uniqCombinedMerge(12)(sources) AS sources,
    uniqCombinedMerge(12)(countries) AS countries,
    quantilesMerge(0.1, 0.9)(size) AS size
  FROM ddos_logs
  WHERE TimeReceived > now() - INTERVAL 60 MINUTE
  GROUP BY
    TimeReceived,
    DstAddr,
    Proto,
    SrcPort
)
WHERE (Gbps > 1)
   OR ((Proto = 'UDP') AND (Gbps > 0.2)) 
   OR ((sources > 20) AND (Gbps > 0.1)) 
   OR ((countries > 10) AND (Gbps > 0.1))
ORDER BY
  TimeReceived DESC,
  Gbps DESC

Gluing everything together To sum up, building an anti-DDoS system requires to following these steps:
  1. define a set of criteria to detect a DDoS attack,
  2. translate these criteria into SQL requests,
  3. pre-aggregate flows into SummingMergeTree tables,
  4. query and transform the results to a BIRD configuration file, and
  5. configure your routers to pull the routes from BIRD.
A Python script like the following one can handle the fourth step. For each attacked target, it generates both a Flowspec rule and a blackhole route.
import socket
import types
from clickhouse_driver import Client as CHClient
# Put your SQL query here!
SQL_QUERY = " "
# How many anti-DDoS rules we want at the same time?
MAX_DDOS_RULES = 20
def empty_ruleset():
    ruleset = types.SimpleNamespace()
    ruleset.flowspec = types.SimpleNamespace()
    ruleset.blackhole = types.SimpleNamespace()
    ruleset.flowspec.v4 = []
    ruleset.flowspec.v6 = []
    ruleset.blackhole.v4 = []
    ruleset.blackhole.v6 = []
    return ruleset
current_ruleset = empty_ruleset()
client = CHClient(host="clickhouse.akvorado.net")
while True:
    results = client.execute(SQL_QUERY)
    seen =  
    new_ruleset = empty_ruleset()
    for (t, addr, proto, port, gbps, mpps, sources, countries, size) in results:
        if (addr, proto, port) in seen:
            continue
        seen[(addr, proto, port)] = True
        # Flowspec
        if addr.ipv4_mapped:
            address = addr.ipv4_mapped
            rules = new_ruleset.flowspec.v4
            table = "flow4"
            mask = 32
            nh = "proto"
        else:
            address = addr
            rules = new_ruleset.flowspec.v6
            table = "flow6"
            mask = 128
            nh = "next header"
        if size[0] == size[1]:
            length = f"length =  int(size[0]) "
        else:
            length = f"length >=  int(size[0])  && <=  int(size[1]) "
        header = f"""
# Time:  t 
# Source:  address , protocol:  proto , port:  port 
# Gbps/Mpps:  gbps:.3 / mpps:.3 , packet size:  int(size[0]) <=X<= int(size[1]) 
# Flows:  flows , sources:  sources , countries:  countries 
"""
        rules.append(
                f""" header 
route  table   
  dst  address / mask ;
  sport =  port ;
   length ;
   nh  =  socket.getprotobyname(proto) ;
 
  bgp_ext_community.add((generic, 0x80060000, 0x00000000));
 ;
"""
        )
        # Blackhole
        if addr.ipv4_mapped:
            rules = new_ruleset.blackhole.v4
        else:
            rules = new_ruleset.blackhole.v6
        rules.append(
            f""" header 
route  address / mask  blackhole  
  bgp_community.add((65535, 666));
 ;
"""
        )
        new_ruleset.flowspec.v4 = list(
            set(new_ruleset.flowspec.v4[:MAX_DDOS_RULES])
        )
        new_ruleset.flowspec.v6 = list(
            set(new_ruleset.flowspec.v6[:MAX_DDOS_RULES])
        )
        # TODO: advertise changes by mail, chat, ...
        current_ruleset = new_ruleset
        changes = False
        for rules, path in (
            (current_ruleset.flowspec.v4, "v4-flowspec"),
            (current_ruleset.flowspec.v6, "v6-flowspec"),
            (current_ruleset.blackhole.v4, "v4-blackhole"),
            (current_ruleset.blackhole.v6, "v6-blackhole"),
        ):
            path = os.path.join("/etc/bird/", f" path .conf")
            with open(f" path .tmp", "w") as f:
                for r in rules:
                    f.write(r)
            changes = (
                changes or not os.path.exists(path) or not samefile(path, f" path .tmp")
            )
            os.rename(f" path .tmp", path)
        if not changes:
            continue
        proc = subprocess.Popen(
            ["birdc", "configure"],
            stdin=subprocess.DEVNULL,
            stdout=subprocess.PIPE,
            stderr=subprocess.PIPE,
        )
        stdout, stderr = proc.communicate(None)
        stdout = stdout.decode("utf-8", "replace")
        stderr = stderr.decode("utf-8", "replace")
        if proc.returncode != 0:
            logger.error(
                "  error:\n \n ".format(
                    "birdc reconfigure",
                    "\n".join(
                        [" O:  ".format(line) for line in stdout.rstrip().split("\n")]
                    ),
                    "\n".join(
                        [" E:  ".format(line) for line in stderr.rstrip().split("\n")]
                    ),
                )
            )

Until Akvorado integrates DDoS detection and mitigation, the ideas presented in this blog post provide a solid foundation to get started with your own anti-DDoS system.

  1. ClickHouse can export results using Markdown format when appending FORMAT Markdown to the query.
  2. While most DNS clients should retry with TCP on failures, this is not always the case: until recently, musl libc did not implement this.
  3. The materialized view also aggregates the data at hand, both for efficiency and to ensure we work with the right data types.

13 February 2023

Vincent Bernat: Building a SQL-like language to filter flows

Akvorado collects network flows using IPFIX or sFlow. It stores them in a ClickHouse database. A web console allows a user to query the data and plot some graphs. A nice aspect of this console is how we can filter flows with a SQL-like language:
Filter editor in Akvorado console
Often, web interfaces expose a query builder to build such filters. I think combining a SQL-like language with an editor supporting completion, syntax highlighting, and linting is a better approach.1 The language parser is built with pigeon (Go) from a parsing expression grammar or PEG. The editor component is CodeMirror (TypeScript).

Language parser PEG grammars are relatively recent2 and are an alternative to context-free grammars. They are easier to write and they can generate better error messages. Python switched from an LL(1)-based parser to a PEG-based parser in Python 3.9. pigeon generates a parser for Go. A grammar is a set of rules. Each rule is an identifier, with an optional user-friendly label for error messages, an expression, and an action in Go to be executed on match. You can find the complete grammar in parser.peg. Here is a simplified rule:
ConditionIPExpr "condition on IP"  
  column:("ExporterAddress"i   return "ExporterAddress", nil  
        / "SrcAddr"i   return "SrcAddr", nil  
        / "DstAddr"i   return "DstAddr", nil  ) _ 
  operator:("=" / "!=") _ 
  ip:IP  
    return fmt.Sprintf("%s %s IPv6StringToNum(%s)",
      toString(column), toString(operator), quote(ip)), nil
   
The rule identifier is ConditionIPExpr. It case-insensitively matches ExporterAddress, SrcAddr, or DstAddr. The action for each case returns the proper case for the column name. That s what is stored in the column variable. Then, it matches one of the possible operators. As there is no code block, it stores the matched string directly in the operator variable. Then, it tries to match the IP rule, which is defined elsewhere in the grammar. If it succeeds, it stores the result of the match in the ip variable and executes the final action. The action turns the column, operator, and IP into a proper expression for ClickHouse. For example, if we have ExporterAddress = 203.0.113.15, we get ExporterAddress = IPv6StringToNum('203.0.113.15'). The IP rule uses a rudimentary regular expression but checks if the matched address is correct in the action block, thanks to netip.ParseAddr():
IP "IP address"   [0-9A-Fa-f:.]+  
  ip, err := netip.ParseAddr(string(c.text))
  if err != nil  
    return "", errors.New("expecting an IP address")
   
  return ip.String(), nil
 
Our parser safely turns the filter into a WHERE clause accepted by ClickHouse:3
WHERE InIfBoundary = 'external' 
AND ExporterRegion = 'france' 
AND InIfConnectivity = 'transit' 
AND SrcAS = 15169 
AND DstAddr BETWEEN toIPv6('2a01:e0f:ffff::') 
                AND toIPv6('2a01:e0f:ffff:ffff:ffff:ffff:ffff:ffff')

Integration in CodeMirror CodeMirror is a versatile code editor that can be easily integrated into JavaScript projects. In Akvorado, the Vue.js component, InputFilter, uses CodeMirror as its foundation and leverages features such as syntax highlighting, linting, and completion. The source code for these capabilities can be found in the codemirror/lang-filter/ directory.

Syntax highlighting The PEG grammar for Go cannot be utilized directly4 and the requirements for parsers for editors are distinct: they should be error-tolerant and operate incrementally, as code is typically updated character by character. CodeMirror offers a solution through its own parser generator, Lezer. We don t need this additional parser to fully understand the filter language. Only the basic structure is needed: column names, comparison and logic operators, quoted and unquoted values. The grammar is therefore quite short and does not need to be updated often:
@top Filter  
  expression
 
expression  
 Not expression  
 "(" expression ")"  
 "(" expression ")" And expression  
 "(" expression ")" Or expression  
 comparisonExpression And expression  
 comparisonExpression Or expression  
 comparisonExpression
 
comparisonExpression  
 Column Operator Value
 
Value  
  String   Literal   ValueLParen ListOfValues ValueRParen
 
ListOfValues  
  ListOfValues ValueComma (String   Literal)  
  String   Literal
 
// [ ]
@tokens  
  // [ ]
  Column   std.asciiLetter (std.asciiLetter std.digit)*  
  Operator   $[a-zA-Z!=><]+  
  String  
    '"' (![\\\n"]   "\\" _)* '"'?  
    "'" (![\\\n']   "\\" _)* "'"?
   
  Literal   (std.digit   std.asciiLetter   $[.:/])+  
  // [ ]
 
The expression SrcAS = 12322 AND (DstAS = 1299 OR SrcAS = 29447) is parsed to:
Filter(Column, Operator, Value(Literal),
  And, Column, Operator, Value(Literal),
  Or, Column, Operator, Value(Literal))
The last step is to teach CodeMirror how to map each token to a highlighting tag:
export const FilterLanguage = LRLanguage.define( 
  parser: parser.configure( 
    props: [
      styleTags( 
        Column: t.propertyName,
        String: t.string,
        Literal: t.literal,
        LineComment: t.lineComment,
        BlockComment: t.blockComment,
        Or: t.logicOperator,
        And: t.logicOperator,
        Not: t.logicOperator,
        Operator: t.compareOperator,
        "( )": t.paren,
       ),
    ],
   ),
 );

Linting We offload linting to the original parser in Go. The /api/v0/console/filter/validate endpoint accepts a filter and returns a JSON structure with the errors that were found:
 
  "message": "at line 1, position 12: string literal not terminated",
  "errors": [ 
    "line":    1,
    "column":  12,
    "offset":  11,
    "message": "string literal not terminated",
   ]
 
The linter source for CodeMirror queries the API and turns each error into a diagnostic.

Completion The completion system takes a hybrid approach. It splits the work between the frontend and the backend to offer useful suggestions for completing filters. The frontend uses the parser built with Lezer to determine the context of the completion: do we complete a column name, an operator, or a value? It also extracts the column name if we are completing something else. It forwards the result to the backend through the /api/v0/console/filter/complete endpoint. Walking the syntax tree was not as easy as I thought, but unit tests helped a lot. The backend uses the parser generated by pigeon to complete a column name or a comparison operator. For values, the completions are either static or extracted from the ClickHouse database. A user can complete an AS number from an organization name thanks to the following snippet:
results := []struct  
  Label  string  ch:"label" 
  Detail string  ch:"detail" 
 
columnName := "DstAS"
sqlQuery := fmt.Sprintf( 
 SELECT concat('AS', toString(%s)) AS label, dictGet('asns', 'name', %s) AS detail
 FROM flows
 WHERE TimeReceived > date_sub(minute, 1, now())
 AND detail != ''
 AND positionCaseInsensitive(detail, $1) >= 1
 GROUP BY label, detail
 ORDER BY COUNT(*) DESC
 LIMIT 20
 , columnName, columnName)
if err := conn.Select(ctx, &results, sqlQuery, input.Prefix); err != nil  
  c.r.Err(err).Msg("unable to query database")
  break
 
for _, result := range results  
  completions = append(completions, filterCompletion 
    Label:  result.Label,
    Detail: result.Detail,
    Quoted: false,
   )
 
In my opinion, the completion system is a major factor in making the field editor an efficient way to select flows. While a query builder may have been more beginner-friendly, the completion system s ease of use and functionality make it more enjoyable to use once you become familiar.

  1. Moreover, building a query builder did not seem like a fun task for me.
  2. They were introduced in 2004 in Parsing Expression Grammars: A Recognition-Based Syntactic Foundation. LR parsers were introduced in 1965, LALR parsers in 1969, and LL parsers in the 1970s. Yacc, a popular parser generator, was written in 1975.
  3. The parser returns a string. It does not generate an intermediate AST. This makes it simpler and it currently fits our needs.
  4. It could be manually translated to JavaScript with PEG.js.

11 February 2023

Vincent Bernat: Hacking the Geberit Sigma 70 flush plate

My toilet is equipped with a Geberit Sigma 70 flush plate. The sales pitch for this hydraulic-assisted device praises the ingenious mount that acts like a rocker switch. In practice, the flush is very capricious and has a very high failure rate. Avoid this type of mechanism! Prefer a fully mechanical version like the Geberit Sigma 20. After several plumbers, exchanges with Geberit s technical department, and the expensive replacement of the entire mechanism, I was still getting a failure rate of over 50% for the small flush. I finally managed to decrease this rate to 5% by applying two 8 mm silicone bumpers on the back of the plate. Their locations are indicated by red circles on the picture below:
Geberit Sigma 70 flush plate. Top: the mechanism that converts the mechanical press into a hydraulic impulse. Bottom: the back of the plate with the two places where to apply the bumpers.
Geberit Sigma 70 flush plate. Above: the mechanism installed on the wall. Below, the back of the glass plate. In red, the two places where to apply the silicone bumpers.
Expect to pay about 5 and as many minutes for this operation.

6 February 2023

Vincent Bernat: Fast and dynamic encoding of Protocol Buffers in Go

Protocol Buffers are a popular choice for serializing structured data due to their compact size, fast processing speed, language independence, and compatibility. There exist other alternatives, including Cap n Proto, CBOR, and Avro. Usually, data structures are described in a proto definition file (.proto). The protoc compiler and a language-specific plugin convert it into code:
$ head flow-4.proto
syntax = "proto3";
package decoder;
option go_package = "akvorado/inlet/flow/decoder";
message FlowMessagev4  
  uint64 TimeReceived = 2;
  uint32 SequenceNum = 3;
  uint64 SamplingRate = 4;
  uint32 FlowDirection = 5;
$ protoc -I=. --plugin=protoc-gen-go --go_out=module=akvorado:. flow-4.proto
$ head inlet/flow/decoder/flow-4.pb.go
// Code generated by protoc-gen-go. DO NOT EDIT.
// versions:
//      protoc-gen-go v1.28.0
//      protoc        v3.21.12
// source: inlet/flow/data/schemas/flow-4.proto
package decoder
import (
        protoreflect "google.golang.org/protobuf/reflect/protoreflect"
Akvorado collects network flows using IPFIX or sFlow, decodes them with GoFlow2, encodes them to Protocol Buffers, and sends them to Kafka to be stored in a ClickHouse database. Collecting a new field, such as source and destination MAC addresses, requires modifications in multiple places, including the proto definition file and the ClickHouse migration code. Moreover, the cost is paid by all users.1 It would be nice to have an application-wide schema and let users enable or disable the fields they need. While the main goal is flexibility, we do not want to sacrifice performance. On this front, this is quite a success: when upgrading from 1.6.4 to 1.7.1, the decoding and encoding performance almost doubled!
goos: linux
goarch: amd64
pkg: akvorado/inlet/flow
cpu: AMD Ryzen 5 5600X 6-Core Processor
                              initial.txt                 final.txt               
                                 sec/op        sec/op     vs base                 
Netflow/with_encoding-12      12.963    2%   7.836    1%  -39.55% (p=0.000 n=10)
Sflow/with_encoding-12         19.37    1%   10.15    2%  -47.63% (p=0.000 n=10)

Faster Protocol Buffers encoding I use the following code to benchmark both the decoding and encoding process. Initially, the Decode() method is a thin layer above GoFlow2 producer and stores the decoded data into the in-memory structure generated by protoc. Later, some of the data will be encoded directly during flow decoding. This is why we measure both the decoding and the encoding.2
func BenchmarkDecodeEncodeSflow(b *testing.B)  
    r := reporter.NewMock(b)
    sdecoder := sflow.New(r)
    data := helpers.ReadPcapPayload(b,
        filepath.Join("decoder", "sflow", "testdata", "data-1140.pcap"))
    for _, withEncoding := range []bool true, false   
        title := map[bool]string 
            true:  "with encoding",
            false: "without encoding",
         [withEncoding]
        var got []*decoder.FlowMessage
        b.Run(title, func(b *testing.B)  
            for i := 0; i < b.N; i++  
                got = sdecoder.Decode(decoder.RawFlow 
                    Payload: data,
                    Source: net.ParseIP("127.0.0.1"),
                 )
                if withEncoding  
                    for _, flow := range got  
                        buf := []byte 
                        buf = protowire.AppendVarint(buf, uint64(proto.Size(flow)))
                        proto.MarshalOptions .MarshalAppend(buf, flow)


         )
     
 
The canonical Go implementation for Protocol Buffers, google.golang.org/protobuf is not the most efficient one. For a long time, people were relying on gogoprotobuf. However, the project is now deprecated. A good replacement is vtprotobuf.3
goos: linux
goarch: amd64
pkg: akvorado/inlet/flow
cpu: AMD Ryzen 5 5600X 6-Core Processor
                              initial.txt               bench-2.txt              
                                sec/op        sec/op     vs base                 
Netflow/with_encoding-12      12.96    2%   10.28    2%  -20.67% (p=0.000 n=10)
Netflow/without_encoding-12   8.935    2%   8.975    2%        ~ (p=0.143 n=10)
Sflow/with_encoding-12        19.37    1%   16.67    2%  -13.93% (p=0.000 n=10)
Sflow/without_encoding-12     14.62    3%   14.87    1%   +1.66% (p=0.007 n=10)

Dynamic Protocol Buffers encoding We have our baseline. Let s see how to encode our Protocol Buffers without a .proto file. The wire format is simple and rely a lot on variable-width integers. Variable-width integers, or varints, are an efficient way of encoding unsigned integers using a variable number of bytes, from one to ten, with small values using fewer bytes. They work by splitting integers into 7-bit payloads and using the 8th bit as a continuation indicator, set to 1 for all payloads except the last.
Variable-width integers encoding in Protocol Buffers: conversion of 150 to a varint
Variable-width integers encoding in Protocol Buffers
For our usage, we only need two types: variable-width integers and byte sequences. A byte sequence is encoded by prefixing it by its length as a varint. When a message is encoded, each key-value pair is turned into a record consisting of a field number, a wire type, and a payload. The field number and the wire type are encoded as a single variable-width integer called a tag.
Message encoded with Protocol Buffers: three varints, two sequences of bytes
Message encoded with Protocol Buffers
We use the following low-level functions to build the output buffer: Our schema abstraction contains the appropriate information to encode a message (ProtobufIndex) and to generate a proto definition file (fields starting with Protobuf):
type Column struct  
    Key       ColumnKey
    Name      string
    Disabled  bool
    // [ ]
    // For protobuf.
    ProtobufIndex    protowire.Number
    ProtobufType     protoreflect.Kind // Uint64Kind, Uint32Kind,  
    ProtobufEnum     map[int]string
    ProtobufEnumName string
    ProtobufRepeated bool
 
We have a few helper methods around the protowire functions to directly encode the fields while decoding the flows. They skip disabled fields or non-repeated fields already encoded. Here is an excerpt of the sFlow decoder:
sch.ProtobufAppendVarint(bf, schema.ColumnBytes, uint64(recordData.Base.Length))
sch.ProtobufAppendVarint(bf, schema.ColumnProto, uint64(recordData.Base.Protocol))
sch.ProtobufAppendVarint(bf, schema.ColumnSrcPort, uint64(recordData.Base.SrcPort))
sch.ProtobufAppendVarint(bf, schema.ColumnDstPort, uint64(recordData.Base.DstPort))
sch.ProtobufAppendVarint(bf, schema.ColumnEType, helpers.ETypeIPv4)
For fields that are required later in the pipeline, like source and destination addresses, they are stored unencoded in a separate structure:
type FlowMessage struct  
    TimeReceived uint64
    SamplingRate uint32
    // For exporter classifier
    ExporterAddress netip.Addr
    // For interface classifier
    InIf  uint32
    OutIf uint32
    // For geolocation or BMP
    SrcAddr netip.Addr
    DstAddr netip.Addr
    NextHop netip.Addr
    // Core component may override them
    SrcAS     uint32
    DstAS     uint32
    GotASPath bool
    // protobuf is the protobuf representation for the information not contained above.
    protobuf      []byte
    protobufSet   bitset.BitSet
 
The protobuf slice holds encoded data. It is initialized with a capacity of 500 bytes to avoid resizing during encoding. There is also some reserved room at the beginning to be able to encode the total size as a variable-width integer. Upon finalizing encoding, the remaining fields are added and the message length is prefixed:
func (schema *Schema) ProtobufMarshal(bf *FlowMessage) []byte  
    schema.ProtobufAppendVarint(bf, ColumnTimeReceived, bf.TimeReceived)
    schema.ProtobufAppendVarint(bf, ColumnSamplingRate, uint64(bf.SamplingRate))
    schema.ProtobufAppendIP(bf, ColumnExporterAddress, bf.ExporterAddress)
    schema.ProtobufAppendVarint(bf, ColumnSrcAS, uint64(bf.SrcAS))
    schema.ProtobufAppendVarint(bf, ColumnDstAS, uint64(bf.DstAS))
    schema.ProtobufAppendIP(bf, ColumnSrcAddr, bf.SrcAddr)
    schema.ProtobufAppendIP(bf, ColumnDstAddr, bf.DstAddr)
    // Add length and move it as a prefix
    end := len(bf.protobuf)
    payloadLen := end - maxSizeVarint
    bf.protobuf = protowire.AppendVarint(bf.protobuf, uint64(payloadLen))
    sizeLen := len(bf.protobuf) - end
    result := bf.protobuf[maxSizeVarint-sizeLen : end]
    copy(result, bf.protobuf[end:end+sizeLen])
    return result
 
Minimizing allocations is critical for maintaining encoding performance. The benchmark tests should be run with the -benchmem flag to monitor allocation numbers. Each allocation incurs an additional cost to the garbage collector. The Go profiler is a valuable tool for identifying areas of code that can be optimized:
$ go test -run=__nothing__ -bench=Netflow/with_encoding \
>         -benchmem -cpuprofile profile.out \
>         akvorado/inlet/flow
goos: linux
goarch: amd64
pkg: akvorado/inlet/flow
cpu: AMD Ryzen 5 5600X 6-Core Processor
Netflow/with_encoding-12             143953              7955 ns/op            8256 B/op        134 allocs/op
PASS
ok      akvorado/inlet/flow     1.418s
$ go tool pprof profile.out
File: flow.test
Type: cpu
Time: Feb 4, 2023 at 8:12pm (CET)
Duration: 1.41s, Total samples = 2.08s (147.96%)
Entering interactive mode (type "help" for commands, "o" for options)
(pprof) web
After using the internal schema instead of code generated from the proto definition file, the performance improved. However, this comparison is not entirely fair as less information is being decoded and previously GoFlow2 was decoding to its own structure, which was then copied to our own version.
goos: linux
goarch: amd64
pkg: akvorado/inlet/flow
cpu: AMD Ryzen 5 5600X 6-Core Processor
                              bench-2.txt                bench-3.txt              
                                 sec/op        sec/op     vs base                 
Netflow/with_encoding-12      10.284    2%   7.758    3%  -24.56% (p=0.000 n=10)
Netflow/without_encoding-12    8.975    2%   7.304    2%  -18.61% (p=0.000 n=10)
Sflow/with_encoding-12         16.67    2%   14.26    1%  -14.50% (p=0.000 n=10)
Sflow/without_encoding-12      14.87    1%   13.56    2%   -8.80% (p=0.000 n=10)
As for testing, we use github.com/jhump/protoreflect: the protoparse package parses the proto definition file we generate and the dynamic package decodes the messages. Check the ProtobufDecode() method for more details.4 To get the final figures, I have also optimized the decoding in GoFlow2. It was relying heavily on binary.Read(). This function may use reflection in certain cases and each call allocates a byte array to read data. Replacing it with a more efficient version provides the following improvement:
goos: linux
goarch: amd64
pkg: akvorado/inlet/flow
cpu: AMD Ryzen 5 5600X 6-Core Processor
                              bench-3.txt                bench-4.txt              
                                 sec/op        sec/op     vs base                 
Netflow/with_encoding-12       7.758    3%   7.365    2%   -5.07% (p=0.000 n=10)
Netflow/without_encoding-12    7.304    2%   6.931    3%   -5.11% (p=0.000 n=10)
Sflow/with_encoding-12        14.256    1%   9.834    2%  -31.02% (p=0.000 n=10)
Sflow/without_encoding-12     13.559    2%   9.353    2%  -31.02% (p=0.000 n=10)
It is now easier to collect new data and the inlet component is faster!

Notice Some paragraphs were editorialized by ChatGPT, using editorialize and keep it short as a prompt. The result was proofread by a human for correctness. The main idea is that ChatGPT should be better at English than me.


  1. While empty fields are not serialized to Protocol Buffers, empty columns in ClickHouse take some space, even if they compress well. Moreover, unused fields are still decoded and they may clutter the interface.
  2. There is a similar function using NetFlow. NetFlow and IPFIX protocols are less complex to decode than sFlow as they are using a simpler TLV structure.
  3. vtprotobuf generates more optimized Go code by removing an abstraction layer. It directly generates the code encoding each field to bytes:
    if m.OutIfSpeed != 0  
        i = encodeVarint(dAtA, i, uint64(m.OutIfSpeed))
        i--
        dAtA[i] = 0x6
        i--
        dAtA[i] = 0xd8
     
    
  4. There is also a protoprint package to generate proto definition file. I did not use it.

26 December 2022

Vincent Bernat: Managing infrastructure with Terraform, CDKTF, and NixOS

A few years ago, I downsized my personal infrastructure. Until 2018, there were a dozen containers running on a single Hetzner server.1 I migrated my emails to Fastmail and my DNS zones to Gandi. It left me with only my blog to self-host. As of today, my low-scale infrastructure is composed of 4 virtual machines running NixOS on Hetzner Cloud and Vultr, a handful of DNS zones on Gandi and Route 53, and a couple of Cloudfront distributions. It is managed by CDK for Terraform (CDKTF), while NixOS deployments are handled by NixOps. In this article, I provide a brief introduction to Terraform, CDKTF, and the Nix ecosystem. I also explain how to use Nix to access these tools within your shell, so you can quickly start using them.

CDKTF: infrastructure as code Terraform is an infrastructure-as-code tool. You can define your infrastructure by declaring resources with the HCL language. This language has some additional features like loops to declare several resources from a list, built-in functions you can call in expressions, and string templates. Terraform relies on a large set of providers to manage resources.

Managing servers Here is a short example using the Hetzner Cloud provider to spawn a virtual machine:
variable "hcloud_token"  
  sensitive = true
 
provider "hcloud"  
  token = var.hcloud_token
 
resource "hcloud_server" "web03"  
  name = "web03"
  server_type = "cpx11"
  image = "debian-11"
  datacenter = "nbg1-dc3"
 
resource "hcloud_rdns" "rdns4-web03"  
  server_id = hcloud_server.web03.id
  ip_address = hcloud_server.web03.ipv4_address
  dns_ptr = "web03.luffy.cx"
 
resource "hcloud_rdns" "rdns6-web03"  
  server_id = hcloud_server.web03.id
  ip_address = hcloud_server.web03.ipv6_address
  dns_ptr = "web03.luffy.cx"
 
HCL expressiveness is quite limited and I find a general-purpose language more convenient to describe all the resources. This is where CDK for Terraform comes in: you can manage your infrastructure using your preferred programming language, including TypeScript, Go, and Python. Here is the previous example using CDKTF and TypeScript:
import   App, TerraformStack, Fn   from "cdktf";
import   HcloudProvider   from "./.gen/providers/hcloud/provider";
import * as hcloud from "./.gen/providers/hcloud";
class MyStack extends TerraformStack  
  constructor(scope: Construct, name: string)  
    super(scope, name);
    const hcloudToken = new TerraformVariable(this, "hcloudToken",  
      type: "string",
      sensitive: true,
     );
    const hcloudProvider = new HcloudProvider(this, "hcloud",  
      token: hcloudToken.value,
     );
    const web03 = new hcloud.server.Server(this, "web03",  
      name: "web03",
      serverType: "cpx11",
      image: "debian-11",
      datacenter: "nbg1-dc3",
      provider: hcloudProvider,
     );
    new hcloud.rdns.Rdns(this, "rdns4-web03",  
      serverId: Fn.tonumber(web03.id),
      ipAddress: web03.ipv4Address,
      dnsPtr: "web03.luffy.cx",
      provider: hcloudProvider,
     );
    new hcloud.rdns.Rdns(this, "rdns6-web03",  
      serverId: Fn.tonumber(web03.id),
      ipAddress: web03.ipv6Address,
      dnsPtr: "web03.luffy.cx",
      provider: hcloudProvider,
     );
   
 
const app = new App();
new MyStack(app, "cdktf-take1");
app.synth();
Running cdktf synth generates a configuration file for Terraform, terraform plan previews the changes, and terraform apply applies them. Now that you have a general-purpose language, you can use functions.

Managing DNS records While using CDKTF for 4 web servers may seem a tad overkill, this is quite different when it comes to managing a few DNS zones. With DNSControl, which is using JavaScript as a domain-specific language, I was able to define the bernat.ch zone with this snippet of code:
D("bernat.ch", REG_NONE, DnsProvider(DNS_BIND, 0), DnsProvider(DNS_GANDI),
  DefaultTTL('2h'),
  FastMailMX('bernat.ch',  subdomains: ['vincent'] ),
  WebServers('@'),
  WebServers('vincent');
This generated 38 records. With CDKTF, I use:
new Route53Zone(this, "bernat.ch", providers.aws)
  .sign(dnsCMK)
  .registrar(providers.gandiVB)
  .www("@", servers)
  .www("vincent", servers)
  .www("media", servers)
  .fastmailMX(["vincent"]);
All the magic is in the code that I did not show you. You can check the dns.ts file in the cdktf-take1 repository to see how it works. Here is a quick explanation:
  • Route53Zone() creates a new zone hosted by Route 53,
  • sign() signs the zone with the provided master key,
  • registrar() registers the zone to the registrar of the domain and sets up DNSSEC,
  • www() creates A and AAAA records for the provided name pointing to the web servers,
  • fastmailMX() creates the MX records and other support records to direct emails to Fastmail.
Here is the content of the fastmailMX() function. It generates a few records and returns the current zone for chaining:
fastmailMX(subdomains?: string[])  
  (subdomains ?? [])
    .concat(["@", "*"])
    .forEach((subdomain) =>
      this.MX(subdomain, [
        "10 in1-smtp.messagingengine.com.",
        "20 in2-smtp.messagingengine.com.",
      ])
    );
  this.TXT("@", "v=spf1 include:spf.messagingengine.com ~all");
  ["mesmtp", "fm1", "fm2", "fm3"].forEach((dk) =>
    this.CNAME( $ dk ._domainkey ,  $ dk .$ this.name .dkim.fmhosted.com. )
  );
  this.TXT("_dmarc", "v=DMARC1; p=none; sp=none");
  return this;
 
I encourage you to browse the repository if you need more information.

About Pulumi My first tentative around Terraform was to use Pulumi. You can find this attempt on GitHub. This is quite similar to what I currently do with CDKTF. The main difference is that I am using Python instead of TypeScript because I was not familiar with TypeScript at the time.2 Pulumi predates CDKTF and it uses a slightly different approach. CDKTF generates a Terraform configuration (in JSON format instead of HCL), delegating planning, state management, and deployment to Terraform. It is therefore bound to the limitations of what can be expressed by Terraform, notably when you need to transform data obtained from one resource to another.3 Pulumi needs specific providers for each resource. Many Pulumi providers are thin wrappers encapsulating Terraform providers. While Pulumi provides a good user experience, I switched to CDKTF because writing providers for Pulumi is a chore. CDKTF does not require such a step. Outside the big players (AWS, Azure and Google Cloud), the existence, quality, and freshness of the Pulumi providers are inconsistent. Most providers rely on a Terraform provider and they may lag a few versions behind, miss a few resources, or have a few bugs of their own. When a provider does not exist, you can write one with the help of the pulumi-terraform-bridge library. The Pulumi project provides a boilerplate for this purpose. I had a bad experience with it when writing providers for Gandi and Vultr: the Makefile automatically installs Pulumi using a curl sh pattern and does not work with /bin/sh. There is a lack of interest for community-based contributions4 or even for providers for smaller players.

NixOS & NixOps Nix is a functional, purely-functional programming language. Nix is also the name of the package manager that is built on top of the Nix language. It allows users to declaratively install packages. nixpkgs is a repository of packages. You can install Nix on top of a regular Linux distribution. If you want more details, a good resource is the official website, and notably the learn section. There is a steep learning curve, but the reward is tremendous.

NixOS: declarative Linux distribution NixOS is a Linux distribution built on top of the Nix package manager. Here is a configuration snippet to add some packages:
environment.systemPackages = with pkgs;
  [
    bat
    htop
    liboping
    mg
    mtr
    ncdu
    tmux
  ];
It is possible to alter an existing derivation5 to use a different version, enable a specific feature, or apply a patch. Here is how I enable and configure Nginx to disable the stream module, add the Brotli compression module, and add the IP address anonymizer module. Moreover, instead of using OpenSSL 3, I keep using OpenSSL 1.1.6
services.nginx =  
  enable = true;
  package = (pkgs.nginxStable.override  
    withStream = false;
    modules = with pkgs.nginxModules; [
      brotli
      ipscrub
    ];
    openssl = pkgs.openssl_1_1;
   );
If you need to add some patches, it is also possible. Here are the patches I added in 2019 to circumvent the DoS vulnerabilities in Nginx until they were fixed in NixOS:7
services.nginx.package = pkgs.nginxStable.overrideAttrs (old:  
  patches = oldAttrs.patches ++ [
    # HTTP/2: reject zero length headers with PROTOCOL_ERROR.
    (pkgs.fetchpatch  
      url = https://github.com/nginx/nginx/commit/dbdd[ ].patch;
      sha256 = "a48190[ ]";
     )
    # HTTP/2: limited number of DATA frames.
    (pkgs.fetchpatch  
      url = https://github.com/nginx/nginx/commit/94c5[ ].patch;
      sha256 = "af591a[ ]";
     )
    #  HTTP/2: limited number of PRIORITY frames.
    (pkgs.fetchpatch  
      url = https://github.com/nginx/nginx/commit/39bb[ ].patch;
      sha256 = "1ad8fe[ ]";
     )
  ];
 );
If you are interested, have a look at my relatively small configuration: common.nix contains the configuration to be applied to any host (SSH, users, common software packages), web.nix contains the configuration for the web servers, isso.nix runs Isso into a systemd container.

NixOps: NixOS deployment tool On a single node, NixOS configuration is in the /etc/nixos/configuration.nix file. After modifying it, you have to run nixos-rebuild switch. Nix fetches all possible dependencies from the binary cache and builds the remaining packages. It creates a new entry in the boot loader menu and activates the new configuration. To manage several nodes, there exists several options, including NixOps, deploy-rs, Colmena, and morph. I do not know all of them, but from my point of view, the differences are not that important. It is also possible to build such a tool yourself as Nix provides the most important building blocks: nix build and nix copy. NixOps is one of the first tools available but I encourage you to explore the alternatives. NixOps configuration is written in Nix. Here is a simplified configuration to deploy znc01.luffy.cx, web01.luffy.cx, and web02.luffy.cx, with the help of the server and web functions:
let
  server = hardware: name: imports:  
    deployment.targetHost = "$ name .luffy.cx";
    networking.hostName = name;
    networking.domain = "luffy.cx";
    imports = [ (./hardware/. + "/$ hardware .nix") ] ++ imports;
   ;
  web = hardware: idx: imports:
    server hardware "web$ lib.fixedWidthNumber 2 idx " ([ ./web.nix ] ++ imports);
in  
  network.description = "Luffy infrastructure";
  network.enableRollback = true;
  defaults = import ./common.nix;
  znc01 = server "exoscale" [ ./znc.nix ];
  web01 = web "hetzner" 1 [ ./isso.nix ];
  web02 = web "hetzner" 2 [];
 

Tying everything together with Nix The Nix ecosystem is a unified solution to the various problems around software and configuration management. A very interesting feature is the declarative and reproducible developer environments. This is similar to Python virtual environments, except it is not language-specific.

Brief introduction to Nix flakes I am using flakes, a new Nix feature improving reproducibility by pinning all dependencies and making the build hermetic. While the feature is marked as experimental,8 it is widely used and you may see flake.nix and flake.lock at the root of some repositories. As a short example, here is the flake.nix content shipped with Snimpy, an interactive SNMP tool for Python relying on libsmi, a C library:
 
  inputs =  
    nixpkgs.url = "nixpkgs";
    flake-utils.url = "github:numtide/flake-utils";
   ;
  outputs =   self, ...  @inputs:
    inputs.flake-utils.lib.eachDefaultSystem (system:
      let
        pkgs = inputs.nixpkgs.legacyPackages."$ system ";
      in
       
        # nix build
        packages.default = pkgs.python3Packages.buildPythonPackage  
          name = "snimpy";
          src = self;
          preConfigure = ''echo "1.0.0-0-000000000000" > version.txt'';
          checkPhase = "pytest";
          checkInputs = with pkgs.python3Packages; [ pytest mock coverage ];
          propagatedBuildInputs = with pkgs.python3Packages; [ cffi pysnmp ipython ];
          buildInputs = [ pkgs.libsmi ];
         ;
        # nix run + nix shell
        apps.default =   
          type = "app";
          program = "$ self.packages."$ system ".default /bin/snimpy";
         ;
        # nix develop
        devShells.default = pkgs.mkShell  
          name = "snimpy-dev";
          buildInputs = [
            self.packages."$ system ".default.inputDerivation
            pkgs.python3Packages.ipython
          ];
         ;
       );
 
If you have Nix installed on your system:
  • nix run github:vincentbernat/snimpy runs Snimpy,
  • nix shell github:vincentbernat/snimpy provides a shell with Snimpy ready-to-use,
  • nix build github:vincentbernat/snimpy builds the Python package, tests included, and
  • nix develop . provides a shell to hack around Snimpy when run from a fresh checkout.9
For more information about Nix flakes, have a look at the tutorial from Tweag.

Nix and CDKTF At the root of the repository I use for CDKTF, there is a flake.nix file to set up a shell with Terraform and CDKTF installed and with the appropriate environment variables to automate my infrastructure. Terraform is already packaged in nixpkgs. However, I need to apply a patch on top of the Gandi provider. Not a problem with Nix!
terraform = pkgs.terraform.withPlugins (p: [
  p.aws
  p.hcloud
  p.vultr
  (p.gandi.overrideAttrs
    (old:  
      src = pkgs.fetchFromGitHub  
        owner = "vincentbernat";
        repo = "terraform-provider-gandi";
        rev = "feature/livedns-key";
        hash = "sha256-V16BIjo5/rloQ1xTQrdd0snoq1OPuDh3fQNW7kiv/kQ=";
       ;
     ))
]);
CDKTF is written in TypeScript. I have a package.json file with all the dependencies needed, including the ones to use TypeScript as the language to define infrastructure:
 
  "name": "cdktf-take1",
  "version": "1.0.0",
  "main": "main.js",
  "types": "main.ts",
  "private": true,
  "dependencies":  
    "@types/node": "^14.18.30",
    "cdktf": "^0.13.3",
    "cdktf-cli": "^0.13.3",
    "constructs": "^10.1.151",
    "eslint": "^8.27.0",
    "prettier": "^2.7.1",
    "ts-node": "^10.9.1",
    "typescript": "^3.9.10",
    "typescript-language-server": "^2.1.0"
   
 
I use Yarn to get a yarn.lock file that can be used directly to declare a derivation containing all the dependencies:
nodeEnv = pkgs.mkYarnModules  
  pname = "cdktf-take1-js-modules";
  version = "1.0.0";
  packageJSON = ./package.json;
  yarnLock = ./yarn.lock;
 ;
The next step is to generate the CDKTF providers from the Terraform providers and turn them into a derivation:
cdktfProviders = pkgs.stdenvNoCC.mkDerivation  
  name = "cdktf-providers";
  nativeBuildInputs = [
    pkgs.nodejs
    terraform
  ];
  src = nix-filter  
    root = ./.;
    include = [ ./cdktf.json ./tsconfig.json ];
   ;
  buildPhase = ''
    export HOME=$(mktemp -d)
    export CHECKPOINT_DISABLE=1
    export DISABLE_VERSION_CHECK=1
    export PATH=$ nodeEnv /node_modules/.bin:$PATH
    ln -nsf $ nodeEnv /node_modules node_modules
    # Build all providers we have in terraform
    for provider in $(cd $ terraform /libexec/terraform-providers; echo */*/*/*); do
      version=''$ provider##*/ 
      provider=''$ provider%/* 
      echo "Build $provider@$version"
      cdktf provider add --force-local $provider@$version   cat
    done
    echo "Compile TS   JS"
    tsc
  '';
  installPhase = ''
    mv .gen $out
    ln -nsf $ nodeEnv /node_modules $out/node_modules
  '';
 ;
Finally, we can define the development environment:
devShells.default = pkgs.mkShell  
  name = "cdktf-take1";
  buildInputs = [
    pkgs.nodejs
    pkgs.yarn
    terraform
  ];
  shellHook = ''
    # No telemetry
    export CHECKPOINT_DISABLE=1
    # No autoinstall of plugins
    export CDKTF_DISABLE_PLUGIN_CACHE_ENV=1
    # Do not check version
    export DISABLE_VERSION_CHECK=1
    # Access to node modules
    export PATH=$PWD/node_modules/.bin:$PATH
    ln -nsf $ nodeEnv /node_modules node_modules
    ln -nsf $ cdktfProviders  .gen
    # Credentials
    for p in \
      njf.nznmba.pbz/Nqzvavfgengbe \
      urgmare.pbz/ivaprag@oreang.pu \
      ihyge.pbz/ihyge@ivaprag.oreang.pu; do
        eval $(pass show $(echo $p   tr 'A-Za-z' 'N-ZA-Mn-za-m')   grep '^export')
    done
    eval $(pass show personal/cdktf/secrets   grep '^export')
    export TF_VAR_hcloudToken="$HCLOUD_TOKEN"
    export TF_VAR_vultrApiKey="$VULTR_API_KEY"
    unset VULTR_API_KEY HCLOUD_TOKEN
  '';
 ;
The derivations listed in buildInputs are available in the provided shell. The content of shellHook is sourced when starting the shell. It sets up some symbolic links to make the JavaScript environment built at an earlier step available, as well as the generated CDKTF providers. It also exports all the credentials.10 I am also using direnv with an .envrc to automatically load the development environment. This also enables the environment to be available from inside Emacs, notably when using lsp-mode to get TypeScript completions. Without direnv, nix develop . can activate the environment. I use the following commands to deploy the infrastructure:11
$ cdktf synth
$ cd cdktf.out/stacks/cdktf-take1
$ terraform plan --out plan
$ terraform apply plan
$ terraform output -json > ~-automation/nixops-take1/cdktf.json
The last command generates a JSON file containing various data to complete the deployment with NixOps.

NixOps The JSON file exported by Terraform contains the list of servers with various attributes:
 
  "hardware": "hetzner",
  "ipv4Address": "5.161.44.145",
  "ipv6Address": "2a01:4ff:f0:b91::1",
  "name": "web05.luffy.cx",
  "tags": [
    "web",
    "continent:NA",
    "continent:SA"
  ]
 
In network.nix, this list is imported and transformed into an attribute set describing the servers. A simplified version looks like this:
let
  lib = inputs.nixpkgs.lib;
  shortName = name: builtins.elemAt (lib.splitString "." name) 0;
  domainName = name: lib.concatStringsSep "." (builtins.tail (lib.splitString "." name));
  server = hardware: name: imports:  
    networking =  
      hostName = shortName name;
      domain = domainName name;
     ;
    deployment.targetHost = name;
    imports = [ (./hardware/. + "/$ hardware .nix") ] ++ imports;
   ;
  cdktf-servers-json = (lib.importJSON ./cdktf.json).servers.value;
  cdktf-servers = map
    (s:
      let
        tags-maybe-import = map (t: ./. + "/$ t .nix") s.tags;
        tags-import = builtins.filter (t: builtins.pathExists t) tags-maybe-import;
      in
       
        name = shortName s.name;
        value = server s.hardware s.name tags-import;
       )
    cdktf-servers-json;
in
 
  // [ ]
  // builtins.listToAttrs cdktf-servers
For web05, this expands to:
web05 =  
  networking =  
    hostName = "web05";
    domainName = "luffy.cx";
   ;
  deployment.targetHost = "web05.luffy.cx";
  imports = [ ./hardware/hetzner.nix ./web.nix ];
 ;
As for CDKTF, at the root of the repository I use for NixOps, there is a flake.nix file to set up a shell with NixOps configured. Because NixOps do not support rollouts, I usually use the following commands to deploy on a single server:12
$ nix flake update
$ nixops deploy --include=web04
$ ./tests web04.luffy.cx
If the tests are OK, I deploy the remaining nodes gradually with the following command:
$ (set -e; for h in web 03..06 ; do nixops deploy --include=$h; done)
nixops deploy rolls out all servers in parallel and therefore could cause a short outage where all Nginx are down at the same time.
This post has been a work-in-progress for the past three years, with the content being updated and refined as I experimented with different solutions. There is still much to explore13 but I feel there is enough content to publish now.

  1. It was an AMD Athlon 64 X2 5600+ with 2 GB of RAM and 2 400 GB disks with software RAID. I was paying something around 59 per month for it. While it was a good deal in 2008, by 2018 it was no longer cost-effective. It was running on Debian Wheezy with Linux-VServer for isolation, both of which were outdated in 2018.
  2. I also did not use Python because Poetry support in Nix was a bit broken around the time I started hacking around CDKTF.
  3. Pulumi can apply arbitrary functions with the apply() method on an output. It makes it easy to transform data that are not known during the planning stage. Terraform has functions to serve a similar purpose, but they are more limited.
  4. The two mentioned pull requests are not merged yet. The second one is superseded by PR #61, submitted two months later, which enforces the use of /bin/bash. I also submitted PR #56, which was merged 4 months later and quickly reverted without an explanation.
  5. You may consider packages and derivations to be synonyms in the Nix ecosystem.
  6. OpenSSL 3 has outstanding performance regressions.
  7. NixOS can be a bit slow to integrate patches since they need to rebuild parts of the binary cache before releasing the fixes. In this specific case, they were fast: the vulnerability and patches were released on August 13th 2019 and available in NixOS on August 15th. As a comparison, Debian only released the fixed version on August 22nd, which is unusually late.
  8. Because flakes are experimental, many documentations do not use them and it is an additional aspect to learn.
  9. It is possible to replace . with github:vincentbernat/snimpy, like in the other commands, but having Snimpy dependencies without Snimpy source code is less interesting.
  10. I am using pass as a password manager. The password names are only obfuscated to avoid spam.
  11. The cdktf command can wrap the terraform commands, but I prefer to use them directly as they are more flexible.
  12. If the change is risky, I disable the server with CDKTF. This removes it from the web service DNS records.
  13. I would like to replace NixOps with an alternative handling progressive rollouts and checks. I am also considering switching to Nomad or Kubernetes to deploy workloads.

11 December 2022

Vincent Bernat: Akvorado: a flow collector, enricher, and visualizer

Earlier this year, we released Akvorado, a flow collector, enricher, and visualizer. It receives network flows from your routers using either NetFlow v9, IPFIX, or sFlow. Several pieces of information are added, like GeoIP and interface names. The flows are exported to Apache Kafka, a distributed queue, then stored inside ClickHouse, a column-oriented database. A web frontend is provided to run queries. A live version is available for you to play.
Akvorado web interface displays the result of a simple query using stacked areas
Akvorado s web frontend
Several alternatives exist: Akvorado differentiates itself from these solutions because: The proposed deployment solution relies on Docker Compose to set up Akvorado, Zookeeper, Kafka, and ClickHouse. I hope it should be enough for anyone to get started quickly. Akvorado is performant enough to handle 100 000 flows per second with 64 GB of RAM and 24 vCPU. With 2 TB of disk, you should expect to keep data for a few years. I spent some time writing a fairly complete documentation. It seems redundant to repeat its content in this blog post. There is also a section about its internal design if you are interested in how it is built. I also did a FRnOG presentation earlier this year, and a ClickHouse meetup presentation, which focuses more on how ClickHouse is used. I plan to write more detailed articles on specific aspects of Akvorado. Stay tuned!

  1. While the collector could write directly to the database, the queue buffers flows if the database is unavailable. It also enables you to process flows with another piece of software (like an anti-DDoS system).

3 December 2022

Vincent Bernat: Broken commit diff on Cisco IOS XR

TL;DR Never trust show commit changes diff on Cisco IOS XR.

Cisco IOS XR is the operating system running for the Cisco ASR, NCS, and 8000 routers. Compared to Cisco IOS, it features a candidate configuration and a running configuration. In configuration mode, you can modify the first one and issue the commit command to apply it to the running configuration.1 This is a common concept for many NOS. Before committing the candidate configuration to the running configuration, you may want to check the changes that have accumulated until now. That s where the show commit changes diff command2 comes up. Its goal is to show the difference between the running configuration (show running-configuration) and the candidate configuration (show configuration merge). How hard can it be? Let s put an interface down on IOS XR 7.6.2 (released in August 2022):
RP/0/RP0/CPU0:router(config)#int Hu0/1/0/1 shut
RP/0/RP0/CPU0:router(config)#show commit changes diff
Wed Nov 23 11:08:30.275 CET
Building configuration...
!! IOS XR Configuration 7.6.2
+  interface HundredGigE0/1/0/1
+   shutdown
   !
end
The + sign before interface HundredGigE0/1/0/1 makes it look like you did create a new interface. Maybe there was a typo? No, the diff is just broken. If you look at the candidate configuration, everything is like you expect:
RP/0/RP0/CPU0:router(config)#show configuration merge int Hu0/1/0/1
Wed Nov 23 11:08:43.360 CET
interface HundredGigE0/1/0/1
 description PNI: (some description)
 bundle id 4000 mode active
 lldp
  receive disable
  transmit disable
 !
 shutdown
 load-interval 30
Here is a more problematic example on IOS XR 7.2.2 (released in January 2021). We want to unconfigure three interfaces:
RP/0/RP0/CPU0:router(config)#no int GigabitEthernet 0/0/0/5
RP/0/RP0/CPU0:router(config)#int TenGigE 0/0/0/5 shut
RP/0/RP0/CPU0:router(config)#no int TenGigE 0/0/0/28
RP/0/RP0/CPU0:router(config)#int TenGigE 0/0/0/28 shut
RP/0/RP0/CPU0:router(config)#no int TenGigE 0/0/0/29
RP/0/RP0/CPU0:router(config)#int TenGigE 0/0/0/29 shut
RP/0/RP0/CPU0:router(config)#show commit changes diff
Mon Nov  7 15:07:22.990 CET
Building configuration...
!! IOS XR Configuration 7.2.2
-  interface GigabitEthernet0/0/0/5
-   shutdown
   !
+  interface TenGigE0/0/0/5
+   shutdown
   !
   interface TenGigE0/0/0/28
-   description Trunk (some description)
-   bundle id 2 mode active
   !
end
The two first commands are correctly represented by the first two chunks of the diff: we remove GigabitEthernet0/0/0/5 and create TenGigE0/0/0/5. The two next commands are also correctly represented by the last chunk of the diff. TenGigE0/0/0/28 was already shut down, so it is expected that only description and bundle id are removed. However, the diff command forgets about the modifications for TenGigE0/0/0/29. The diff should include a chunk similar to the last one.
RP/0/RP0/CPU0:router(config)#show run int TenGigE 0/0/0/29
Mon Nov  7 15:07:43.571 CET
interface TenGigE0/0/0/29
 description Trunk to other router
 bundle id 2 mode active
 shutdown
!
RP/0/RP0/CPU0:router(config)#show configuration merge int TenGigE 0/0/0/29
Mon Nov  7 15:07:53.584 CET
interface TenGigE0/0/0/29
 shutdown
!
How can the diff be correct for TenGigE0/0/0/28 but incorrect for TenGigE0/0/0/29 while they have the same configuration? How can you trust the diff command if it forgets part of the configuration? Do you remember the last time you ran an Ansible playbook and discovered the whole router ospf block disappeared without a warning? If you use automation tools, you should check how the diff is assembled. Automation tools should build it from the result of show running-config and show configuration merge. This is what NAPALM does. This is not what cisco.iosxr collection for Ansible does. The problem is not limited to the interface directives. You can get similar issues for other parts of the configuration. For example, here is what we get when removing inactive BGP neighbors on IOS XR 7.2.2:
RP/0/RP0/CPU0:router(config)#router bgp 65400
RP/0/RP0/CPU0:router(config-bgp)#vrf public
RP/0/RP0/CPU0:router(config-bgp-vrf)#no neighbor 217.29.66.1
RP/0/RP0/CPU0:router(config-bgp-vrf)#no neighbor 217.29.66.75
RP/0/RP0/CPU0:router(config-bgp-vrf)#no neighbor 217.29.66.110
RP/0/RP0/CPU0:router(config-bgp-vrf)#no neighbor 217.29.66.112
RP/0/RP0/CPU0:router(config-bgp-vrf)#no neighbor 217.29.66.158
RP/0/RP0/CPU0:router(config-bgp-vrf)#show commit changes diff
Tue Aug  2 13:58:02.536 CEST
Building configuration...
!! IOS XR Configuration 7.2.2
   router bgp 65400
    vrf public
-    neighbor 217.29.66.1
-     remote-as 16004
-     use neighbor-group MIX_IPV4_PUBLIC
-     description MIX: MIX-IT
     !
-    neighbor 217.29.66.75
-     remote-as 49367
-     use neighbor-group MIX_IPV4_PUBLIC
     !
-    neighbor 217.29.67.10
-     remote-as 19679
     !
-    neighbor 217.29.67.15
-    neighbor 217.29.66.112
-     remote-as 8075
-     use neighbor-group MIX_IPV4_PUBLIC
-     description MIX: Microsoft
-     address-family ipv4 unicast
-      maximum-prefix 1500 95 restart 5
      !
     !
-    neighbor 217.29.66.158
-     remote-as 24482
-     use neighbor-group MIX_IPV4_PUBLIC
-     description MIX: SG.GS
-     address-family ipv4 unicast
     !
     !
    !
   !
end
The only correct chunk is for neighbor 217.29.66.112. All the others are missing some of the removed lines. 217.29.67.15 is even missing all of them. How bad is the code providing such a diff? I could go all day with examples such as these. Cisco TAC is happy to open a case in DDTS, their bug tracker, to fix specific occurrences of this bug.3 However, I fail to understand why the XR team is not just providing the diff between show run and show configuration merge. The output would always be correct!

  1. IOS XR has several limitations. The most inconvenient one is the inability to change the AS number in the router bgp directive. Such a limitation is a great pain for both operations and automation.
  2. This command could have been just show commit, as show commit changes diff is the only valid command you can execute from this point. Starting from IOS XR 7.5.1, show commit changes diff precise is also a valid command. However, I have failed to find any documentation about it and it seems to provide the same output as show commit changes diff. That s how clunky IOS XR can be.
  3. See CSCwa26251 as an example of a fix for something I reported earlier this year. You need a valid Cisco support contract to be able to see its content.

16 October 2022

Vincent Fourmond: Tutorial: analysis of multiwavelength fast kinetics data

The purpose of this post is to demonstrate a first approach to the analysis of multiwavelength kinetic data, like those obtained using stopped-flow data. To practice, we will use data that were acquired during the stopped flow practicals of the MetBio summer school from the FrenchBIC. During the practicals, the student monitored the reaction of myoglobin (in its Fe(III) state) with azide, which yields a fast and strong change in the absorbance spectrum of the protein, which was monitored using a diode array. The data is publicly available on zenodo. Aims of this tutorial The purpose of this tutorial is to teach you to use the free softwareQSoas to run a simple, multiwavelength exponential fit on the data, and to look at the results. This is not a kinetics lecture, so that it will not go in depth about the use of the exponential fit and its meaning. Getting started: loading the file First, make sure you have a working version of QSoas, you can download them (for free) there. Then download the data files from zenodo. We will work only on the data file Azide-1.25mm_001.dat, but of course, the purpose of this tutorial is to enable you to work on all of them. The data files contain the time evolution of the absorbance for all wavelengths, in a matrix format, in which each row correpond to a time point and each column to a wavelength. Start QSoas, and launch the command:
QSoas> load /comments='"'
Then, choose the Azide-1.25mm_001.dat data file. This should bring up a horizontal red line at the bottom of the data display, with X values between about 0 and 2.5. If you zoom on the red line with the mouse wheel, you'll realize it is data. The /comments='"' part is very important since it allows the extraction of the wavelength from the data. We will look at what it means another day. At this stage, you can look at the loaded data using the command:
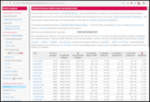
QSoas> edit
You should have a window looking like this:
The rows each correspond to a data point displayed on the window below. The first column correspond to the X values, the second the Y values, and all the other ones to extra Y columns (they are not displayed by default). What is especially interesting is the first row, which contains a nan as the X value and what is obviously the wavelength for all the Y values. To tell that QSoas should take this line as the wavelength (which will be the perpendicular coordinate, the coordinate of the other direction of the matrix), first close the edit window and run:
QSoas> set-perp /from-row=0
Splitting and fitting Now, we have a single dataset containing a lot of Y columns. We want to fit all of them simultaneously with a (mono) exponential fit. For that, we first need to split the big matrix into a series of X,Y datasets (because fitting only works on the first Y). This is possible by running:
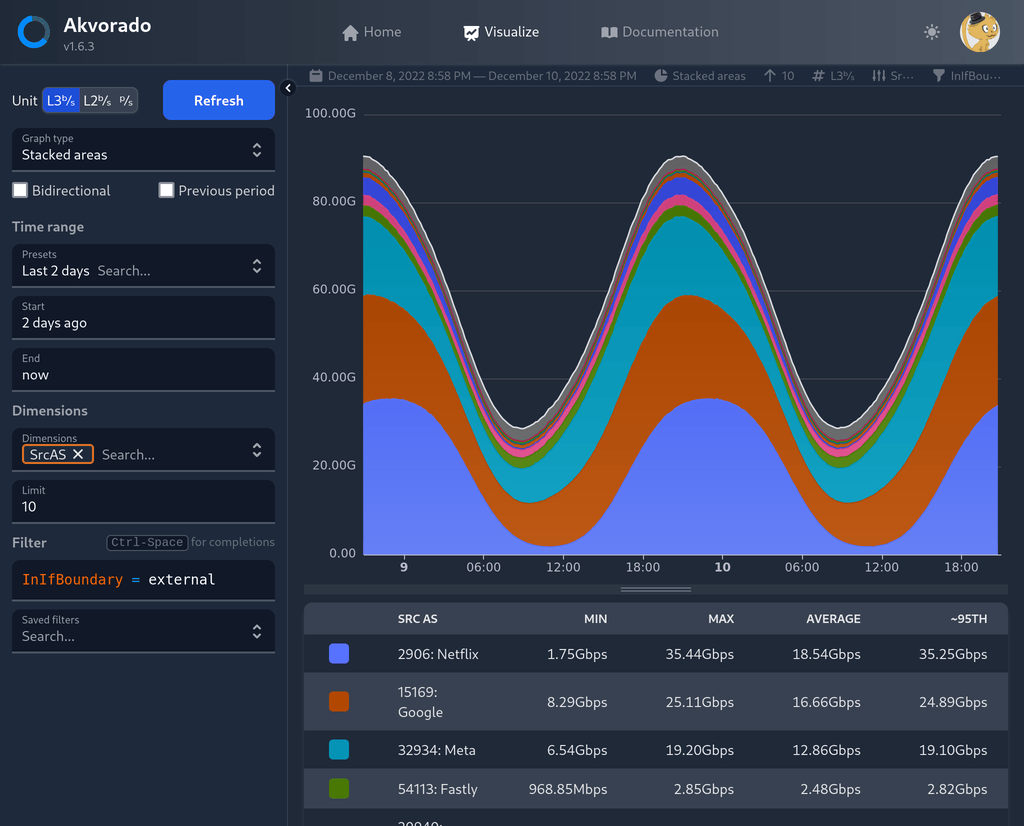
QSoas> expand /style=red-to-blue /flags=kinetics
Your screen should now look like this:
You're looking at the kinetics at all wavelengths at the same time (this may take some time to display on your computer, it is after all a rather large number of data points). The /style=red-to-blue is not strictly necessary, but it gives the red to blue color gradient which makes things easier to look at (and cooler !). The /flags=kinetics is there to attach a label (a flag) to the newly created datasets so we can easily manipulate all of them at the same time. Then it's time to fit, with the following command:
QSoas> mfit-exponential-decay flagged:kinetics
This should bring up a new window. After resizing it, you should have something that looks like this:
The bottom of the fit window is taken by the parameters, each with two checkboxes on the right to set them fixed (i.e. not determined by the fitting mechanism) and/or global (i.e. with a single value for all the datasets, here all the wavelengths). The top shows the current dataset along with the corresponding fit (in green), and, below, the residuals. You can change the dataset by clicking on the horizontal arrows or using Ctrl+PgUp or Ctrl+PgDown (keep holding it to scan fast). See the Z = 728.15 showing that QSoas has recognized that the currently displayed dataset corresponds to the wavelength 728.15. The equation fitted to the data is: $$y(x) = A_\infty + A_1 \times \exp -(x - x_0)/\tau_1$$ In this case, while the \(A_1\) and \(A_\infty\) parameters clearly depend on the wavelength, the time constant of evolution should be independent of wavelength (the process happens at a certain rate regardless of the wavelength we're analyzing), so that the \(\tau_1\) parameter should be common for all the datasets/wavelengths. Just click on the global checkbox at the right of the tau_1 parameter, make sure it is checked, and hit the Fit button... The fit should not take long (less than a minute), and then you end up with the results of the fits: all the parameters. The best way to look at the non global parameters like \(A_1\) and \(A_\infty\) is to use the Show Parameters item from the Parameters menu. Using it and clicking on A_inf too should give you a display like this one:
The A_inf parameter corresponds to the spectum at infinite time (of azide-bound heme), while the A_1 parameter corresponds to the difference spectrum between the initial (azide-free) and final (azide-bound) states. Now, the fit is finished, you can save the parameters if you want to reload them in a later fit by using the Parameters/Save menu item or export them in a form more suitable for plotting using Parameters/Export (although QSoas can also display and the parameters saved using Save). This concludes this first approach to fitting the data. What you can do is How to read the code above All the lines starting by QSoas> in the code areas above are meant to be typed into the QSoas command line (at the bottom of the window), and started by pressing enter at the end. You must remove the QSoas> bit. The other lines (when applicable) show you the response of QSoas, in the terminal just above the command-line. You may want to play with the QSoas tutorial to learn more about how to interact with QSoas. About QSoas QSoas is a powerful open source data analysis program that focuses on flexibility and powerful fitting capacities. It is released under the GNU General Public License. It is described in Fourmond, Anal. Chem., 2016, 88 (10), pp 5050 5052. Current version is 3.1. You can freely (and at no cost) download its source code or precompiled versions for MacOS and Windows there. Alternatively, you can clone from the GitHub repository.
Contact: find my email address there, or contact me on LinkedIn.

28 September 2022

Vincent Fourmond: Version 3.1 of QSoas is out

The new version of QSoas has just been released ! It brings in a host of new features, as the releases before, but maybe the most important change is the following... Binary images now freely available ! Starting from now, all the binary images for the new versions of QSoas will freely available from the download page. You can download the precompiled versions of QSoas for MacOS or windows. So now, you have no reason anymore not to try !
My aim with making the binaries freely available is also to simplify the release process for me and therefore increase the rate at which new versions are released. Improvements to the fit interface Some work went into improving the fit interface, in particular for the handling of fit trajectories when doing parameter space exploration, for difficult fits with many parameters and many local minima. The fit window now features real menus, along with tab a way to display the terminal (see the menus and the tabs selection on the image).
Individual fits have also been improved, with, among others, the possibility to easily simulate voltammograms with the kinetic-system fits, and the handling of Marcus-Hush-Chidsey (or Marcus "distribution of states") kinetics for electron transfers. Column and row names This release greatly improves the handling of column and row names, including commands to easily modify them, the possibility to use Ruby formulas to change them, and a much better way read and write them to data files. Mastering the use of column names (and to a lesser extent, row names) can greatly simplify data handling, especially when dealing with files with a large number of columns. Complex numbers Version 3.1 brings in support for formulas handling complex numbers. Although it is not possible to store complex numbers directly into datasets, it is easy to separate them in real and imaginary parts to your liking. Scripting improvement Two important improvements for scripting are included in version 3.1. The first is the possibility to define virtual files inside a script file, which makes it easy to define subfunctions to run using commands like run-for-each. The second is the possibility to define variables to be reused later (like the script arguments) using the new command let. There are a lot of other new features, improvements and so on, look for the full list there. About QSoas
QSoas is a powerful open source data analysis program that focuses on flexibility and powerful fitting capacities. It is released under the GNU General Public License. It is described in Fourmond, Anal. Chem., 2016, 88 (10), pp 5050 5052. Current version is 3.1. You can download its source code or precompiled versions for MacOS and Windows there. Alternatively, you can clone from the GitHub repository.

16 September 2022

Vincent Bernat: FRnOG #36: Akvorado

Here are the slides I presented for FRnOG #36 in September 2022. They are about Akvorado, a tool to collect network flows and visualize them. It was developped by Free. I didn t get time to publish a blog post yet, but it should happen soon!
The presentation, in French, was recorded. I have added English subtitles.

27 July 2022

Vincent Bernat: ClickHouse SF Bay Area Meetup: Akvorado

Here are the slides I presented for a ClickHouse SF Bay Area Meetup in July 2022, hosted by Altinity. They are about Akvorado, a network flow collector and visualizer, and notably on how it relies on ClickHouse, a column-oriented database.
The meetup was recorded and available on YouTube. Here is the part relevant to my presentation, with subtitles:1
I got a few questions about how to get information from the higher layers, like HTTP. As my use case for Akvorado was at the network edge, my answers were mostly negative. However, as sFlow is extensible, when collecting flows from Linux servers instead, you could embed additional data and they could be exported as well. I also got a question about doing aggregation in a single table. ClickHouse can aggregate automatically data using TTL. My answer for not doing that is partial. There is another reason: the retention periods of the various tables may overlap. For example, the main table keeps data for 15 days, but even in these 15 days, if I do a query on a 12-hour window, it is faster to use the flows_1m0s aggregated table, unless I request something about ports and IP addresses.

  1. To generate the subtitles, I have used Amazon Transcribe, the speech-to-text solution from Amazon AWS. Unfortunately, there is no en-FR language available, which would have been useful for my terrible accent. While the subtitles were 100% accurate when the host, Robert Hodge from Altinity, was speaking, the success rate on my talk was quite lower. I had to rewrite almost all sentences. However, using speech-to-text is still useful to get the timings, as it is also something requiring a lot of work to do manually.

26 December 2021

Vincent Bernat: Custom screen saver with XSecureLock

i3lock is a popular X11 screen lock utility. As far as customization goes, it only allows one to set a background from a PNG file. This limitation is part of the design of i3lock: its primary goal is to keep the screen locked, something difficult enough with X11. Each additional feature would increase the attack surface and move away from this goal.1 Many are frustrated with these limitations and extend i3lock through simple wrapper scripts or by forking it.2 The first solution is usually safe, but the second goes against the spirit of i3lock. XSecureLock is a less-known alternative to i3lock. One of the most attractive features of this locker is to delegate the screen saver feature to another process. This process can be anything as long it can attach to an existing window provided by XSecureLock, which won t pass any input to it. It will also put a black window below it to ensure the screen stays locked in case of a crash. XSecureLock is shipped with a few screen savers, notably one using mpv to display photos or videos, like the Apple TV aerial videos. I have written my own saver using Python and GTK.3 It shows a background image, a clock, and the current weather.4
Custom screen saver for XSecureLock, displaying a clock and the current weather
Custom screen saver for XSecureLock
I add two patches over XSecureLock: XSecureLock also delegates the authentication window to another process, but I was less comfortable providing a custom one as it is a bit more security-sensitive. While basic, the shipped authentication application is fine by me. I think people should avoid modifying i3lock code and use XSecureLock instead. I hope this post will help a bit.

Update (2022-01) XScreenSaver can also run arbitrary programs as a screen saver.


  1. See for example this comment or this one explaining the rationale.
  2. This Reddit post enumerates many of these alternatives.
  3. Using GTK makes it a bit difficult to use some low-level features, like embedding an application into an existing window. However, the high-level features are easier, notably drawing an image and a text with a shadow.
  4. Weather is retrieved by another script running on a timer and written to a file. The screen saver watches this file for updates.

24 December 2021

Vincent Bernat: Automatic login with startx and systemd

If your workstation is using full-disk encryption, you may want to jump directly to your desktop environment after entering the passphrase to decrypt the disk. Many display managers like GDM and LightDM have an autologin feature. However, only GDM can run Xorg with standard user privileges. Here is an alternative using startx and a systemd service:
[Unit]
Description=X11 session for bernat
After=graphical.target systemd-user-sessions.service
[Service]
User=bernat
WorkingDirectory=~
PAMName=login
Environment=XDG_SESSION_TYPE=x11
TTYPath=/dev/tty8
StandardInput=tty
UnsetEnvironment=TERM
UtmpIdentifier=tty8
UtmpMode=user
StandardOutput=journal
ExecStartPre=/usr/bin/chvt 8
ExecStart=/usr/bin/startx -- vt8 -keeptty -verbose 3 -logfile /dev/null
Restart=no
[Install]
WantedBy=graphical.target
Let me explain each block: Drop this unit in /etc/systemd/system/x11-autologin.service and enable it with systemctl enable x11-autologin.service. Xorg is now running rootless and logging into the journal. After using it for a few months, I didn t notice any regression compared to LightDM with autologin.

  1. For more information on how logind provides access to devices, see this blog post. The method names do not match the current implementation, but the concepts are still correct. Xorg takes control of the session when the TTY is active.
  2. Xorg could change the type of the session itself after taking control of it, but it does not.
  3. There is some code in Xorg to do that, but it is executed too late and fails with: xf86OpenConsole: VT_ACTIVATE failed: Operation not permitted.

15 November 2021

Vincent Bernat: Git as a source of truth for network automation

The first step when automating a network is to build the source of truth. A source of truth is a repository of data that provides the intended state: the list of devices, the IP addresses, the network protocols settings, the time servers, etc. A popular choice is NetBox. Its documentation highlights its usage as a source of truth:
NetBox intends to represent the desired state of a network versus its operational state. As such, automated import of live network state is strongly discouraged. All data created in NetBox should first be vetted by a human to ensure its integrity. NetBox can then be used to populate monitoring and provisioning systems with a high degree of confidence.
When introducing Jerikan, a common feedback we got was: you should use NetBox for this. Indeed, Jerikan s source of truth is a bunch of YAML files versioned with Git.

Why Git? If we look at how things are done with servers and services, in a datacenter or in the cloud, we are likely to find users of Terraform, a tool turning declarative configuration files into infrastructure. Declarative configuration management tools like Salt, Puppet,1 or Ansible take care of server configuration. NixOS is an alternative: it combines package management and configuration management with a functional language to build virtual machines and containers. When using a Kubernetes cluster, people use Kustomize or Helm, two other declarative configuration management tools. Tapped together, these tools implement the infrastructure as code paradigm.
Infrastructure as code is an approach to infrastructure automation based on practices from software development. It emphasizes consistent, repeatable routines for provisioning and changing systems and their configuration. You make changes to code, then use automation to test and apply those changes to your systems. Kief Morris, Infrastructure as Code, O Reilly.
A version control system is a central tool for infrastructure as code. The usual candidate is Git with a source code management system like GitLab or GitHub. You get:
Traceability and visibility
Git keeps a log of all changes: what, who, why, and when. With a bit of discipline, each change is explained and self-contained. It becomes part of the infrastructure documentation. When the support team complains about a degraded experience for some customers over the last two months or so, you quickly discover this may be related to a change to an incoming policy in New York.
Rolling back
If a change is defective, it can be reverted quickly, safely, and without much effort, even if other changes happened in the meantime. The policy change at the origin of the problem spanned over three routers. Reverting this specific change and deploying the configuration let you solve the situation until you find a better fix.
Branching, reviewing, merging
When working on a new feature or refactoring some part of the infrastructure, a team member creates a branch and works on their change without interfering with the work of other members. Once the branch is ready, a pull request is created and the change is ready to be reviewed by the other team members before merging. You discover the issue was related to diverting traffic through an IX where one ISP was connected without enough capacity. You propose and discuss a fix that includes a change of the schema and the templates used to declare policies to be able to handle this case.
Continuous integration
For each change, automated tests are triggered. They can detect problems and give more details on the effect of a change. Branches can be deployed to a test infrastructure where regression tests are executed. The results can be synthesized as a comment in the pull request to help the review. You check your proposed change does not modify the other existing policies.

Why not NetBox? NetBox does not share these features. It is a database with a REST and a GraphQL API. Traceability is limited: changes are not grouped into a transaction and they are not documented. You cannot fork the database. Usually, there is one staging database to test modifications before applying them to the production database. It does not scale well and reviews are difficult. Applying the same change to the production database can be hazardous. Rolling back a change is non-trivial.

Update (2021-11) Nautobot, a fork of NetBox, will soon address this point by using Dolt, an SQL database engine allowing you to clone, branch, and merge, like a Git repository. Dolt is compatible with MySQL clients. See Nautobots, Roll Back! for a preview of this feature.

Moreover, NetBox is not usually the single source of truth. It contains your hardware inventory, the IP addresses, and some topology information. However, this is not the place you put authorized SSH keys, syslog servers, or the BGP configuration. If you also use Ansible, this information ends in its inventory. The source of truth is therefore fragmented between several tools with different workflows. Since NetBox 2.7, you can append additional data with configuration contexts. This mitigates this point. The data is arranged hierarchically but the hierarchy cannot be customized.2 Nautobot can manage configuration contexts in a Git repository, while still allowing to use of the API to fetch them. You get some additional perks, thanks to Git, but the remaining data is still in a database with a different lifecycle. Lastly, the schema used by NetBox may not fit your needs and you cannot tweak it. For example, you may have a rule to compute the IPv6 address from the IPv4 address for dual-stack interfaces. Such a relationship cannot be easily expressed and enforced in NetBox. When changing the IPv4 address, you may forget the IPv6 address. The source of truth should only contain the IPv4 address but you also want the IPv6 address in NetBox because this is your IPAM and you need it to update your DNS entries.

Why not Git? There are some limitations when putting your source of truth in Git:
  1. If you want to expose a web interface to allow an external team to request a change, it is more difficult to do it with Git than with a database. Out-of-the-box, NetBox provides a nice web interface and a permission system. You can also write your own web interface and interact with NetBox through its API.
  2. YAML files are more difficult to query in different ways. For example, looking for a free IP address is complex if they are scattered in multiple places.
In my opinion, in most cases, you are better off putting the source of truth in Git instead of NetBox. You get a lot of perks by doing that and you can still use NetBox as a read-only view, usable by other tools. We do that with an Ansible module. In the remaining cases, Git could still fit the bill. Read-only access control can be done through submodules. Pull requests can restrict write access: a bot can check the changes only modify allowed files before auto-merging. This still requires some Git knowledge, but many teams are now comfortable using Git, thanks to its ubiquity.

  1. Wikimedia manages its infrastructure with Puppet. They publish everything on GitHub. Creative Commons uses Salt. They also publish everything on GitHub. Thanks to them for doing that! I wish I could provide more real-life examples.
  2. Being able to customize the hierarchy is key to avoiding repetition in the data. For example, if switches are paired together, some data should be attached to them as a group and not duplicated on each of them. Tags can be used to partially work around this issue but you lose the hierarchical aspect.

6 November 2021

Vincent Bernat: How to rsync files between two remotes?

scp -3 can copy files between two remote hosts through localhost. This comes in handy when the two servers cannot communicate directly or if they are unable to authenticate one to the other.1 Unfortunately, rsync does not support such a feature. Here is a trick to emulate the behavior of scp -3 with SSH tunnels. When syncing with a remote host, rsync invokes ssh to spawn a remote rsync --server process. It interacts with it through its standard input and output. The idea is to recreate the same setup using SSH tunnels and socat, a versatile tool to establish bidirectional data transfers. The first step is to connect to the source server and ask rsync the command-line to spawn the remote rsync --server process. The -e flag overrides the command to use to get a remote shell: instead of ssh, we use echo.
$ ssh web04
$ rsync -e 'sh -c ">&2 echo $@" echo' -aLv /data/. web05:/data/.
web05 rsync --server -vlogDtpre.iLsfxCIvu . /data/.
rsync: connection unexpectedly closed (0 bytes received so far) [sender]
rsync error: error in rsync protocol data stream (code 12) at io.c(228) [sender=3.2.3]
The second step is to connect to the destination server with local port forwarding. When connecting to the local port 5000, the TCP connection is forwarded through SSH to the remote port 5000 and handled by socat. When receiving the connection, socat spawns the rsync --server command we got at the previous step and connects its standard input and output to the incoming TCP socket.
$ ssh -L 127.0.0.1:5000:127.0.0.1:5000 web05
$ socat tcp-listen:5000,reuseaddr exec:"rsync --server -vlogDtpre.iLsfxCIvu . /data/."
The last step is to connect to the source with remote port forwarding. socat is used in place of a regular SSH connection and connects its standard input and output to a TCP socket connected to the remote port 5000. Thanks to the remote port forwarding, SSH forwards the data to the local port 5000. From there, it is relayed back to the destination, as described in the previous step.
$ ssh -R 127.0.0.1:5000:127.0.0.1:5000 web04
$ rsync -e 'sh -c "socat stdio tcp-connect:127.0.0.1:5000"' -aLv /data/. remote:/data/.
sending incremental file list
haproxy.debian.net/
haproxy.debian.net/dists/buster-backports-1.8/Contents-amd64.bz2
haproxy.debian.net/dists/buster-backports-1.8/Contents-i386.bz2
[ ]
media.luffy.cx/videos/2021-frnog34-jerikan/progressive.mp4
sent 921,719,453 bytes  received 26,939 bytes  7,229,383.47 bytes/sec
total size is 7,526,872,300  speedup is 8.17
This little diagram may help understand how everything fits together:
Diagram showing how all processes are connected together: rsync, socat and ssh
How each process is connected together. Arrows labeled stdio are implemented as two pipes connecting the process to the left to the standard input and output of the process to the right. Don't be fooled by the apparent symmetry!
The rsync manual page prohibits the use of --server. Use this hack at your own risk!
The options --server and --sender are used internally by rsync, and should never be typed by a user under normal circumstances. Some awareness of these options may be needed in certain scenarios, such as when setting up a login that can only run an rsync command. For instance, the support directory of the rsync distribution has an example script named rrsync (for restricted rsync) that can be used with a restricted ssh login.

Addendum I was hoping to get something similar with a one-liner. But this does not work!
$ socat \
>  exec:"ssh web04 rsync --server --sender -vlLogDtpre.iLsfxCIvu . /data/." \
>  exec:"ssh web05 rsync --server -vlogDtpre.iLsfxCIvu /data/. /data/." \
over-long vstring received (511 > 255)
rsync error: requested action not supported (code 4) at compat.c(387) [sender=3.2.3]
rsync error: requested action not supported (code 4) at compat.c(387) [Receiver=3.2.3]
socat[878291] E waitpid(): child 878292 exited with status 4
socat[878291] E waitpid(): child 878293 exited with status 4

  1. And SSH agent forwarding is dangerous. Don t use it if you can.

1 October 2021

Vincent Bernat: FRnOG #34: how we deployed a datacenter in one click

Here are the slides I presented for FRnOG #34 in October 2021. They are about automating the deployment of Blade s datacenters using Jerikan and Ansible. For more information, have a look at Jerikan+Ansible: a configuration management system for network.
The presentation, in French, was recorded. I have added English subtitles.1

  1. Good thing if you don t understand French as my diction was poor with a lot of fillers.

Next.