Search Results: "craig"

14 March 2024

Matthew Garrett: Digital forgeries are hard

Closing arguments in the trial between various people and Craig Wright over whether he's Satoshi Nakamoto are wrapping up today, amongst a bewildering array of presented evidence. But one utterly astonishing aspect of this lawsuit is that expert witnesses for both sides agreed that much of the digital evidence provided by Craig Wright was unreliable in one way or another, generally including indications that it wasn't produced at the point in time it claimed to be. And it's fascinating reading through the subtle (and, in some cases, not so subtle) ways that that's revealed.

One of the pieces of evidence entered is screenshots of data from Mind Your Own Business, a business management product that's been around for some time. Craig Wright relied on screenshots of various entries from this product to support his claims around having controlled meaningful number of bitcoin before he was publicly linked to being Satoshi. If these were authentic then they'd be strong evidence linking him to the mining of coins before Bitcoin's public availability. Unfortunately the screenshots themselves weren't contemporary - the metadata shows them being created in 2020. This wouldn't fundamentally be a problem (it's entirely reasonable to create new screenshots of old material), as long as it's possible to establish that the material shown in the screenshots was created at that point. Sadly, well.

One part of the disclosed information was an email that contained a zip file that contained a raw database in the format used by MYOB. Importing that into the tool allowed an audit record to be extracted - this record showed that the relevant entries had been added to the database in 2020, shortly before the screenshots were created. This was, obviously, not strong evidence that Craig had held Bitcoin in 2009. This evidence was reported, and was responded to with a couple of additional databases that had an audit trail that was consistent with the dates in the records in question. Well, partially. The audit record included session data, showing an administrator logging into the data base in 2011 and then, uh, logging out in 2023, which is rather more consistent with someone changing their system clock to 2011 to create an entry, and switching it back to present day before logging out. In addition, the audit log included fields that didn't exist in versions of the product released before 2016, strongly suggesting that the entries dated 2009-2011 were created in software released after 2016. And even worse, the order of insertions into the database didn't line up with calendar time - an entry dated before another entry may appear in the database afterwards, indicating that it was created later. But even more obvious? The database schema used for these old entries corresponded to a version of the software released in 2023.

This is all consistent with the idea that these records were created after the fact and backdated to 2009-2011, and that after this evidence was made available further evidence was created and backdated to obfuscate that. In an unusual turn of events, during the trial Craig Wright introduced further evidence in the form of a chain of emails to his former lawyers that indicated he had provided them with login details to his MYOB instance in 2019 - before the metadata associated with the screenshots. The implication isn't entirely clear, but it suggests that either they had an opportunity to examine this data before the metadata suggests it was created, or that they faked the data? So, well, the obvious thing happened, and his former lawyers were asked whether they received these emails. The chain consisted of three emails, two of which they confirmed they'd received. And they received a third email in the chain, but it was different to the one entered in evidence. And, uh, weirdly, they'd received a copy of the email that was submitted - but they'd received it a few days earlier. In 2024.

And again, the forensic evidence is helpful here! It turns out that the email client used associates a timestamp with any attachments, which in this case included an image in the email footer - and the mysterious time travelling email had a timestamp in 2024, not 2019. This was created by the client, so was consistent with the email having been sent in 2024, not being sent in 2019 and somehow getting stuck somewhere before delivery. The date header indicates 2019, as do encoded timestamps in the MIME headers - consistent with the mail being sent by a computer with the clock set to 2019.

But there's a very weird difference between the copy of the email that was submitted in evidence and the copy that was located afterwards! The first included a header inserted by gmail that included a 2019 timestamp, while the latter had a 2024 timestamp. Is there a way to determine which of these could be the truth? It turns out there is! The format of that header changed in 2022, and the version in the email is the new version. The version with the 2019 timestamp is anachronistic - the format simply doesn't match the header that gmail would have introduced in 2019, suggesting that an email sent in 2022 or later was modified to include a timestamp of 2019.

This is by no means the only indication that Craig Wright's evidence may be misleading (there's the whole argument that the Bitcoin white paper was written in LaTeX when general consensus is that it's written in OpenOffice, given that's what the metadata claims), but it's a lovely example of a more general issue.

Our technology chains are complicated. So many moving parts end up influencing the content of the data we generate, and those parts develop over time. It's fantastically difficult to generate an artifact now that precisely corresponds to how it would look in the past, even if we go to the effort of installing an old OS on an old PC and setting the clock appropriately (are you sure you're going to be able to mimic an entirely period appropriate patch level?). Even the version of the font you use in a document may indicate it's anachronistic. I'm pretty good at computers and I no longer have any belief I could fake an old document.

(References: this Dropbox, under "Expert reports", "Patrick Madden". Initial MYOB data is in "Appendix PM7", further analysis is in "Appendix PM42", email analysis is "Sixth Expert Report of Mr Patrick Madden")

comment count unavailable comments

23 May 2023

Craig Small: Devices with cgroup v2

Docker and other container systems by default restrict access to devices on the host. They used to do this with cgroups with the cgroup v1 system, however, the second version of cgroups removed this controller and the man page says:
Cgroup v2 device controller has no interface files and is implemented on top of cgroup BPF.
https://www.kernel.org/doc/Documentation/admin-guide/cgroup-v2.rst
That is just awesome, nothing to see here, go look at the BPF documents if you have cgroup v2. With cgroup v1 if you wanted to know what devices were permitted, you just would cat /sys/fs/cgroup/XX/devices.allow and you were done! The kernel documentation is not very helpful, sure its something in BPF and has something to do with the cgroup BPF specifically, but what does that mean? There doesn t seem to be an easy corresponding method to get the same information. So to see what restrictions a docker container has, we will have to:
  1. Find what cgroup the programs running in the container belong to
  2. Find what is the eBPF program ID that is attached to our container cgroup
  3. Dump the eBPF program to a text file
  4. Try to interpret the eBPF syntax
The last step is by far the most difficult.

Finding a container s cgroup All containers have a short ID and a long ID. When you run the docker ps command, you get the short id. To get the long id you can either use the --no-trunc flag or just guess from the short ID. I usually do the second.
$ docker ps 
CONTAINER ID   IMAGE            COMMAND       CREATED          STATUS          PORTS     NAMES
a3c53d8aaec2   debian:minicom   "/bin/bash"   19 minutes ago   Up 19 minutes             inspiring_shannon
So the short ID is a3c53d8aaec2 and the long ID is a big ugly hex string starting with that. I generally just paste the relevant part in the next step and hit tab. For this container the cgroup is /sys/fs/cgroup/system.slice/docker-a3c53d8aaec23c256124f03d208732484714219c8b5f90dc1c3b4ab00f0b7779.scope/ Notice that the last directory has docker- then the short ID. If you re not sure of the exact path. The /sys/fs/cgroup is the cgroup v2 mount point which can be found with mount -t cgroup2 and then rest is the actual cgroup name. If you know the process running in the container then the cgroup column in ps will show you.
$ ps -o pid,comm,cgroup 140064
    PID COMMAND         CGROUP
 140064 bash            0::/system.slice/docker-a3c53d8aaec23c256124f03d208732484714219c8b5f90dc1c3b4ab00f0b7779.scope
Either way, you will have your cgroup path.

eBPF programs and cgroups Next we will need to get the eBPF program ID that is attached to our recently found cgroup. To do this, we will need to use the bpftool. One thing that threw me for a long time is when the tool talks about a program or a PROG ID they are talking about the eBPF programs, not your processes! With that out of the way, let s find the prog id.
$ sudo bpftool cgroup list /sys/fs/cgroup/system.slice/docker-a3c53d8aaec23c256124f03d208732484714219c8b5f90dc1c3b4ab00f0b7779.scope/
ID       AttachType      AttachFlags     Name
90       cgroup_device   multi
Our cgroup is attached to eBPF prog with ID of 90 and the type of program is cgroup _device.

Dumping the eBPF program Next, we need to get the actual code that is run every time a process running in the cgroup tries to access a device. The program will take some parameters and will return either a 1 for yes you are allowed or a zero for permission denied. Don t use the file option as it dumps the program in binary format. The text version is hard enough to understand.
sudo bpftool prog dump xlated id 90 > myebpf.txt
Congratulations! You now have the eBPF program in a human-readable (?) format.

Interpreting the eBPF program The eBPF format as dumped is not exactly user friendly. It probably helps to first go and look at an example program to see what is going on. You ll see that the program splits type (lower 4 bytes) and access (higher 4 bytes) and then does comparisons on those values. The eBPF has something similar:
   0: (61) r2 = *(u32 *)(r1 +0)
   1: (54) w2 &= 65535
   2: (61) r3 = *(u32 *)(r1 +0)
   3: (74) w3 >>= 16
   4: (61) r4 = *(u32 *)(r1 +4)
   5: (61) r5 = *(u32 *)(r1 +8)
What we find is that once we get past the first few lines filtering the given value that the comparison lines have:
  • r2 is the device type, 1 is block, 2 is character.
  • r3 is the device access, it s used with r1 for comparisons after masking the relevant bits. mknod, read and write are 1,2 and 3 respectively.
  • r4 is the major number
  • r5 is the minor number
For a even pretty simple setup, you are going to have around 60 lines of eBPF code to look at. Luckily, you ll often find the lines for the command options you added will be near the end, which makes it easier. For example:
  63: (55) if r2 != 0x2 goto pc+4
  64: (55) if r4 != 0x64 goto pc+3
  65: (55) if r5 != 0x2a goto pc+2
  66: (b4) w0 = 1
  67: (95) exit
This is a container using the option --device-cgroup-rule='c 100:42 rwm'. It is checking if r2 (device type) is 2 (char) and r4 (major device number) is 0x64 or 100 and r5 (minor device number) is 0x2a or 42. If any of those are not true, move to the next section, otherwise return with 1 (permit). We have all access modes permitted so it doesn t check for it. The previous example has all permissions for our device with id 100:42, what about if we only want write access with the option --device-cgroup-rule='c 100:42 r'. The resulting eBPF is:
  63: (55) if r2 != 0x2 goto pc+7  
  64: (bc) w1 = w3
  65: (54) w1 &= 2
  66: (5d) if r1 != r3 goto pc+4
  67: (55) if r4 != 0x64 goto pc+3
  68: (55) if r5 != 0x2a goto pc+2
  69: (b4) w0 = 1
  70: (95) exit
The code is almost the same but we are checking that w3 only has the second bit set, which is for reading, effectively checking for X==X&2. It s a cautious approach meaning no access still passes but multiple bits set will fail.

The device option docker run allows you to specify files you want to grant access to your containers with the --device flag. This flag actually does two things. The first is to great the device file in the containers /dev directory, effectively doing a mknod command. The second thing is to adjust the eBPF program. If the device file we specified actually did have a major number of 100 and a minor of 42, the eBPF would look exactly like the above snippets.

What about privileged? So we have used the direct cgroup options here, what does the --privileged flag do? This lets the container have full access to all the devices (if the user running the process is allowed). Like the --device flag, it makes the device files as well, but what does the filtering look like? We still have a cgroup but the eBPF program is greatly simplified, here it is in full:
   0: (61) r2 = *(u32 *)(r1 +0)
   1: (54) w2 &= 65535
   2: (61) r3 = *(u32 *)(r1 +0)
   3: (74) w3 >>= 16
   4: (61) r4 = *(u32 *)(r1 +4)
   5: (61) r5 = *(u32 *)(r1 +8)
   6: (b4) w0 = 1
   7: (95) exit
There is the usual setup lines and then, return 1. Everyone is a winner for all devices and access types!

28 January 2023

Craig Small: Fixing iCalendar feeds

The local government here has all the schools use an iCalendar feed for things like when school terms start and stop and other school events occur. The department s website also has events like public holidays. The issue is that all of them don t make it an all-day event but one that happens at midnight, or one past midnight. The events synchronise fine, though Google s calendar is known for synchronising when it feels like it, not at any particular time you would like it to.
Screenshot of Android Calendar showing a tiny bar at midnight which is the event.
Even though a public holiday is all day, they are sent as appointments for midnight. That means on my phone all the events are these tiny bars that appear right up the top of the screen and are easily missed, especially when the focus of the calendar is during the day. On the phone, you can see the tiny purple bar at midnight. This is how the events appear. It s not the calendar s fault, as far as it knows the school events are happening at midnight. You can also see Lunar New Year and Australia Day appear in the all-day part of the calendar and don t scroll away. That s where these events should be.
Why are all the events appearing at midnight? The reason is the feed is incorrectly set up and has the time. The events are sent in an iCalendar format and a typical event looks like this:
BEGIN:VEVENT
DTSTART;TZID=Australia/Sydney:20230206T000000
DTEND;TZID=Australia/Sydney:20230206T000000
SUMMARY:School Term starts
END:VEVENT
The event starting and stopping date and time are the DTSTART and DTEND lines. Both of them have the date of 2023/02/06 or 6th February 2023 and a time of 00:00:00 or midnight. So the calendar is doing the right thing, we need to fix the feed! The Fix I wrote a quick and dirty PHP script to download the feed from the real site, change the DTSTART and DTEND lines to all-day events and leave the rest of it alone.
<?php
$site = $_GET['s'];
if ($site == 'site1')  
    $REMOTE_URL='https://site1.example.net/ical_feed';
  elseif ($site == 'site2')  
    $REMOTE_URL='https://site2.example.net/ical_feed';
  else  
    http_response_code(400);
    die();
 
$fp = fopen($REMOTE_URL, "r");
if (!$fp)  
    die("fopen");
 
header('Content-Type: text/calendar');
while (( $line = fgets($fp, 1024)) !== false)  
    $line = preg_replace(
        '/^(DTSTART DTEND);[^:]+:([0-9] 8 )T000[01]00/',
        '$ 1 ;VALUE=DATE:$ 2 ',
        $line);
    echo $line;
 
?>
It s pretty quick and nasty but gets the job done. So what is it doing? You need to save the script on your web server somewhere, possibly with an alias command. The whole point of this is to change the type from a date/time to a date-only event and only print the date part of it for the start and end of it. The resulting iCalendar event looks like this:
BEGIN:VEVENT
DTSTART;VALUE=DATE:20230206
DTEND;VALUE=DATE:20230206
SUMMARY:School Term starts
END:VEVENT
The calendar then shows it properly as an all-day event. I would check the script works before doing the next step. You can use things like curl or wget to download it. If you use a normal browser, it will probably just download the translated file. If you re not seeing the right thing then it s probably the PCRE failing. You can check it online with a regex checker such as https://regex101.com. The site has saved my PCRE and match so you got something to start with. Calendar settings The last thing to do is to change the URL in your calendar settings. Each calendar system has a different way of doing it. For Google Calendar they provide instructions and you want to follow the section titled Use a link to add a public Calendar . The URL here is not the actual site s URL (which you would have put into the REMOTE_URL variable before) but the URL of your script plus the ?s=site1 part. So if you put your script aliased to /myical.php and the site ID was site1 and your website is www.example.com the URL would be https://www.example.com/myical.php?s=site1 . You should then see the events appear as all-day events on your calendar.

18 November 2022

Craig Small: Hello world!

Welcome to WordPress. This is your first post. Edit or delete it, then start writing!

12 November 2022

Craig Small: WordPress 6.1

Debian will soon have WordPress version 6.1 I m not really sure of the improvements, but there is a new 2023 theme as part of the update. They really weren t mucking around when they said the 6.0.3 security release would be short-lived. The updates seem to be focused on content creation and making the formatting do what content creators want it to do. For me, I need headings 1 and 2 , paragraphs and preformatted text.

19 July 2022

Craig Small: Linux Memory Statistics

Pretty much everyone who has spent some time on a command line in Linux would have looked at the free command. This command provides some overall statistics on the memory and how it is used. Typical output looks something like this:
             total        used        free      shared  buff/cache  available
Mem:      32717924     3101156    26950016      143608     2666752  29011928
Swap:      1000444           0     1000444
Memory sits in the first row after the headers then we have the swap statistics. Most of the numbers are directly fetched from the procfs file /proc/meminfo which are scaled and presented to the user. A good example of a simple stat is total, which is just the MemTotal row located in that file. For the rest of this post, I ll make the rows from /proc/meminfo have an amber background. What is Free, and what is Used? While you could say that the free value is also merely the MemFree row, this is where Linux memory statistics start to get odd. While that value is indeed what is found for MemFree and not a calculated field, it can be misleading. Most people would assume that Free means free to use, with the implication that only this amount of memory is free to use and nothing more. That would also mean the used value is really used by something and nothing else can use it. In the early days of free and Linux statistics in general that was how it looked. Used is a calculated field (there is no MemUsed row) and was, initially, Total - Free. The problem was, Used also included Buffers and Cached values. This meant that it looked like Linux was using a lot of memory for something. If you read old messages before 2002 that are talking about excessive memory use, they quite likely are looking at the values printed by free. The thing was, under memory pressure the kernel could release Buffers and Cached for use. Not all of the storage but some of it so it wasn t all used. To counter this, free showed a row between Memory and Swap with Used having Buffers and Cached removed and Free having the same values added:
             total       used       free     shared    buffers     cached
Mem:      32717924    6063648   26654276          0     313552    2234436
-/+ buffers/cache:    3515660   29202264
Swap:      1000444          0    1000444
You might notice that this older version of free from around 2001 shows buffers and cached separately and there s no available column (we ll get to Available later.) Shared appears as zero because the old row was labelled MemShared and not Shmem which was changed in Linux 2.6 and I m running a system way past that version. It s not ideal, you can say that the amount of free memory is something above 26654276 and below 29202264 KiB but nothing more accurate. buffers and cached are almost never all-used or all-unused so the real figure is not either of those numbers but something in-between. Cached, just not for Caches That appeared to be an uneasy truce within the Linux memory statistics world for a while. By 2014 we realised that there was a problem with Cached. This field used to have the memory used for a cache for files read from storage. While this value still has that component, it was also being used for tmpfs storage and the use of tmpfs went from an interesting idea to being everywhere. Cheaper memory meant larger tmpfs partitions went from a luxury to something everyone was doing. The problem is with large files put into a tmpfs partition the Free would decrease, but so would Cached meaning the free column in the -/+ row would not change much and understate the impact of files in tmpfs. Lucky enough in Linux 2.6.32 the developers added a Shmem row which was the amount of memory used for shmem and tmpfs. Subtracting that value from Cached gave you the real cached value which we call main_cache and very briefly this is what the cached value would show in free. However, this caused further problems because not all Shem can be reclaimed and reused and probably swapped one set of problematic values for another. It did however prompt the Linux kernel community to have a look at the problem. Enter Available There was increasing awareness of the issues with working out how much memory a system has free within the kernel community. It wasn t just the output of free or the percentage values in top, but load balancer or workload placing systems would have their own view of this value. As memory management and use within the Linux kernel evolved, what was or wasn t free changed and all the userland programs were expected somehow to keep up. The kernel developers realised the best place to get an estimate of the memory not used was in the kernel and they created a new memory statistic called Available. That way if how the memory is used or set to be unreclaimable they could change it and userland programs would go along with it. procps has a fallback for this value and it s a pretty complicated setup.
  1. Find the min_free_kybtes setting in sysfs which is the minimum amount of free memory the kernel will handle
  2. Add a 25% to this value (e.g. if it was 4000 make it 5000), this is the low watermark
  3. To find available, start with MemFree and subtract the low watermark
  4. If half of both Inactive(file) and Active(file) values are greater than the low watermark, add that half value otherwise add the sum of the values minus the low watermark
  5. If half of Slab Claimable is greater than the low watermark, add that half value otherwise add Slab Claimable minus the low watermark
  6. If what you get is less than zero, make available zero
  7. Or, just look at Available in /proc/meminfo
For the free program, we added the Available value and the +/- line was removed. The main_cache value was Cached + Slab while Used was calculated as Total - Free - main_cache - Buffers. This was very close to what the Used column in the +/- line used to show. What s on the Slab? The next issue that came across was the use of slabs. At this point, main_cache was Cached + Slab, but Slab consists of reclaimable and unreclaimable components. One part of Slab can be used elsewhere if needed and the other cannot but the procps tools treated them the same. The Used calculation should not subtract SUnreclaim from the Total because it is actually being used. So in 2015 main_cache was changed to be Cached + SReclaimable. This meant that Used memory was calculated as Total - Free - Cached - SReclaimable - Buffers. Revenge of tmpfs and the return of Available The tmpfs impacting Cached was still an issue. If you added a 10MB file into a tmpfs partition, then Free would reduce by 10MB and Cached would increase by 10MB meaning Used stayed unchanged even though 10MB had gone somewhere. It was time to retire the complex calculation of Used. For procps 4.0.1 onwards, Used now means not available . We take the Total memory and subtract the Available memory. This is not a perfect setup but it is probably going to be the best one we have and testing is giving us much more sensible results. It s also easier for people to understand (take the total value you see in free, then subtract the available value). What does that mean for main_cache which is part of the buff/cache value you see? As this value is no longer in the used memory calculation, it is less important. Should it also be reverted to simply Cached without the reclaimable Slabs? The calculated fields In summary, what this means for the calculated fields in procps at least is: Almost everything else, with the exception of some bounds checking, is what you get out of /proc/meminfo which is straight from the kernel.

20 December 2021

Craig Small: WordPress 5.8.2 Debian packages

After a bit of a delay, WordPress version 5.8.2 packages should be available now. This is a minor update from 5.8.1 which fixes two bugs but not the security bug. The security bug is due to WordPress shipping its own CA store, which is a list of certificates it trusts to sign for websites. Debian WordPress has used the system certificate store which uses /etc/ssl/certs/ca-certificates.crt for years so is not impacted by this change. That CA file is generated by update-ca-certificates and is part of the ca-certificates package. We have also had another go of tamping down the nagging WordPress does about updates, as you cannot use the automatic updates through WordPress but via the usual Debian system. I see we are not fully there as WordPress has a site health page that doesn t like things turned off. The two bugs fixed in 5.8.2 I ve not personally hit, but they might help someone out there. In any case, an update is always good. Next stop 5.9 The next planned release is in late January 2022. I m sure there will be a new default theme, but they are planning on making big changes around the blocks and styles to make it easier to customise the look.

8 December 2021

Craig Small: Fediverse Test Three

This supposedly will go out to the fediverse if I can fix wp-cron.

Craig Small: ap test 4

dfdsfssdffdsfs

Craig Small: ap test3

this is the body

Craig Small: Hello world!

Welcome to WordPress. This is your first post. Edit or delete it, then start writing!

10 November 2021

Craig Small: test ap

Craig Small: Changing Grafana Legends

I m not sure if I just can search Google properly, or this really is just not written down much, but I have had problems with Grafana Legends (I would call them the series labels). The issue is that Grafana queries Prometheus for a time series and you want to display multiple lines, but the time-series labels you get are just not quite right. A simple example is you might be using the black-box exporter to monitor an external TCP port and you would just like the port number separate to display. The default output would look like this:
probe_duration_seconds instance="example.net:5222",job="blackbox",module="xmpp_banner"  = 0.01
probe_duration_seconds instance="example.net:5269",job="blackbox",module="xmpp_banner"  = 0.01
I can graph the number of seconds that it takes to probe the 5222 and 5269 TCP ports, but my graph legend is going to have the hostname, making it cluttered. I just want the legend to be the port numbers on Grafana. The answer is to use a Prometheus function called label_replace that takes an existing label, applies a regular expression, then puts the result into another label. That s right, regular expressions, and if you get them wrong then the label just doesn t appear.
Perl REGEX Problems courtesy of XKCD
The label_replace documentation is a bit terse, and in my opinion, the order of parameters is messed up, but after a few goes I had what I needed:
label_replace(probe_duration_seconds module="xmpp_banner" , "port", "$1", "instance", ".*:(.*)")
probe_duration_seconds instance="example.net:5222",job="blackbox",module="xmpp_banner",port="5222" 	0.001
probe_duration_seconds instance="example.net:5269",job="blackbox",module="xmpp_banner",port="5269" 	0.002
The response now has a new label (or field if you like) called port. So what is this function to our data coming from probe_duration_seconds? The function format is: label_replace(value, dst_label, replacement, src_label, regex) So the function does the following:
  1. Evaluate value, which is generally some sort of query such as probe_duration_seconds
  2. Find the required source label src_label, in this example is instance, in this case the values are example.net:5222 and example.net:5269
  3. Apply regular expression regex, for us its .*:(.*) That says skip everying before : then capture/store everything past : . The brackets mean copy what is after the colon and put it in match #1
  4. Make a new label specified in dst_label, for us this is port
  5. Whatever is in replacement goes into dst_label. For this example it is $1 which means match #1 in our regular expression in the label called port.
In short, the function captures everything after the colon in the instance label and puts that into a new label called port. It does this for each value that is returned into the first parameter. This means I can use the port in my Grafana graph Legend and it will show 5222 or 5269 respectively. I have made the Legend TCP port to give the below result, but I could have used port in Grafana Legend and made the result TCP $1 in the label_replace function to get the same result.
Grafana console showing the use of the label_replace function

13 September 2021

John Goerzen: Facebook s Blocking Decisions Are Deliberate Including Their Censorship of Mastodon

In the aftermath of my report of Facebook censoring mentions of the open-source social network Mastodon, there was a lot of conversation about whether or not this was deliberate. That conversation seemed to focus on whether a human speficially added joinmastodon.org to some sort of blacklist. But that s not even relevant. OF COURSE it was deliberate, because of how Facebook tunes its algorithm. Facebook s algorithm is tuned for Facebook s profit. That means it s tuned to maximize the time people spend on the site engagement. In other words, it is tuned to keep your attention on Facebook. Why do you think there is so much junk on Facebook? So much anti-vax, anti-science, conspiracy nonsense from the likes of Breitbart? It s not because their algorithm is incapable of surfacing the good content; we already know it can because they temporarily pivoted it shortly after the last US election. They intentionally undid its efforts to make high-quality news sources more prominent twice. Facebook has said that certain anti-vax disinformation posts violate its policies. It has an extremely cumbersome way to report them, but it can be done and I have. These reports are met with either silence or a response claiming the content didn t violate their guidelines. So what algorithm is it that allows Breitbart to not just be seen but to thrive on the platform, lets anti-vax disinformation survive even a human review, while banning mentions of Mastodon? One that is working exactly as intended. We may think this algorithm is busted. Clearly, Facebook does not. If their goal is to maximize profit by maximizing engagement, the algorithm is working exactly as designed. I don t know if joinmastodon.org was specifically blacklisted by a human. Nor is it relevant. Facebook s choice to tolerate and promote the things that service its greed for engagement and money, even if they are the lowest dregs of the web, is deliberate. It is no accident that Breitbart does better than Mastodon on Facebook. After all, which of these does its algorithm detect keep people engaged on Facebook itself more? Facebook removes the ban You can see all the screenshots of the censorship in my original post. Now, Facebook has reversed course: 
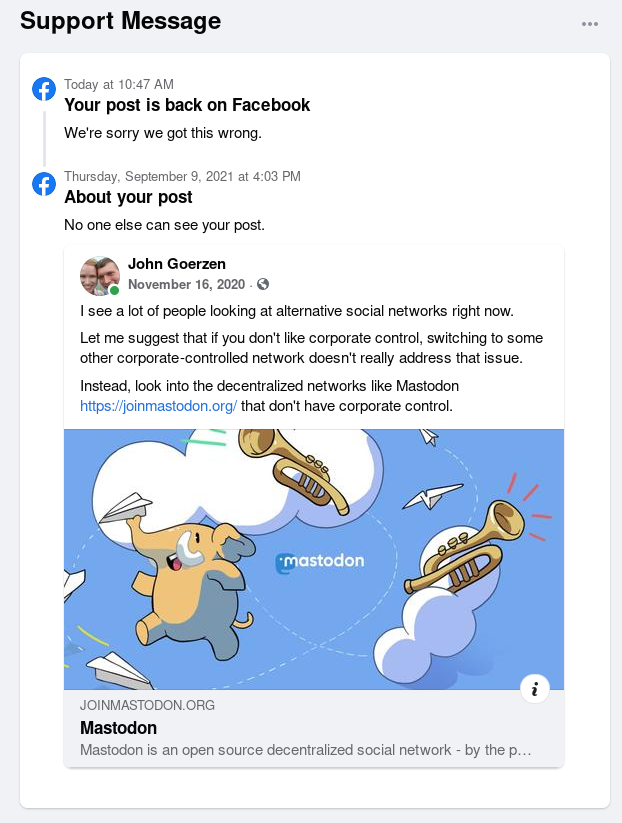
We also don t know if this reversal was human or algorithmic, but that still is beside the point. The point is, Facebook intentionally chooses to surface and promote those things that drive engagement, regardless of quality. Clearly many have wondered if tens of thousands of people have died unnecessary deaths over COVID as a result. One whistleblower says I have blood on my hands and President Biden said they re killing people before walking back his comments slightly . I m not equipped to verify those statements. But what do they think is going to happen if they prioritize engagement over quality? Rainbows and happiness?

18 January 2021

Craig Small: Percent CPU for processes

The ps program gives a snapshot of the processes running on your Unix-like system. On most Linux installations, this will be the ps program from the procps project. While you can get a lot of information from the tool, a lot of the fields need further explanation or can give wrong or confusing information; or putting it another way, they provide the right information that looks wrong. One of these confusing fields is the %CPU or pcpu field. You can see this as the third field with the ps aux command. You only really need the u option to see it, but ps aux is a pretty common invokation. More than 100%? This post was inspired by procps issue 186 where the submitter said that the sum of the processes cannot be more than the number of CPUs times 100%. If you have 1 CPU then the sum of %CPU for all processes should be 100% or less, have 16 CPUs then 1600% is your maximum number. Some people reason for the oddity of over 100% CPU as some rounding thing gone wrong and at first I did think that; except I know we get a lot of reports about comparing the top header CPU load vs process load not lining up and its because they re different . The trick here, is ps is reporting a percentage of what? Or, perhaps to give a better clue, a percentage of when? PCPU Calculations So to get to the bottom of this, let s look at the relevant code. In ps/output.c we have a function pr_pcpu that prints the percent CPU. The relevant lines are:
  total_time = pp->utime + pp->stime;
  if(include_dead_children) total_time += (pp->cutime + pp->cstime);
  seconds = cook_etime(pp);
  if(seconds) pcpu = (total_time * 1000ULL / Hertz) / seconds;
OK, ignoring the include _dead_time line (you get this from the S option and means you include the time this process waited for its children processes) and the scaling (process times are in Jiffies, we have the CPU as 0 to 999 for reasons) you can reduce this down to. %CPU = ( Tutime + Tstime ) / Tetime
So we find the amount of time the CPU(s) have been busy either in userland or the system, add them together, then divide the sum by the total time. The utime and stime increment like a car s odometer. So if a process uses one Jiffy of CPU time in userland, that counter goes to 1. If it does it again a few seconds later, then that counter goes to 2. To give an example, if a process has run for ten seconds and within those ten seconds the CPU has been busy in userland for that process, then we get 10/10 = 100% which makes sense. Not all Start times are the same Let s take another example, a process still consumes ten seconds CPU time but been running for twenty seconds, the answer is 10/20 or 50%. With our single CPU example system both of these cannot be running at the same time otherwise we have 150% CPU utilisation which is not possible. However, let s adjust this slightly. We have assumed uniform utilisation. But take the following scenario: The output for ps -o times,etimes,pcpu,comm would look something like:
    TIME ELAPSED %CPU COMMAND
      10      20   50 P1
      10      10  100 P2
What we will see is P1 has 10/20 or 50% CPU and P2 has 10/10 or 100% CPU. Add those up, and you have 150% CPU, magic! The key here is the ELAPSED column. P1 has given you the CPU utilisation across 20 seconds of system time and P2 the CPU utilisation across only 10 seconds. You directly add them together you get the wrong answer. What s the point of %CPU? Probably the %CPU column gives results that a lot of people are not expecting, so what s the point of it? Don t use it to see why the CPU is running hot; you can see above those two processes were working the CPU hard at different times. What it is useful for is to see how busy a process is, but be warned its an average. It s helpful for something that starts busy but if the process idles or hardly uses CPU for a week then goes bananas you won t see it. The top program, because a lot of its statistics are deltas from the last refresh, is a much better program for this sort of information about what is happening right now.

Craig Small: test2

ignore this

27 July 2020

Russ Allbery: Summer haul

I'm buying rather too many books at the moment and not reading enough of them (in part because I got back into Minecraft and in part because I got a bit stuck on a few difficult books). I think I've managed to get myself unstuck again, though, and have started catching up on reviews. 2020. It's kind of a lot. And I'm not even that heavily affected. Katherine Addison The Angel of the Crows (sff)
Marie Brennan A Natural History of Dragons (sff)
Kacen Callender Queen of the Conquered (sff)
Jo Clayton Diadem from the Stars (sff)
Jo Clayton Lamarchos (sff)
Jo Clayton Irsud (sff)
Clifford D. Conner The Tragedy of American Science (nonfiction)
Kate Elliott Unconquerable Sun (sff)
Rory Fanning & Craig Hodges Long Shot (nonfiction)
Michael Harrington Socialism: Past & Future (nonfiction)
Nalo Hopkinson Brown Girl in the Ring (sff)
Kameron Hurley The Stars Are Legion (sff)
N.K. Jemisin Emergency Skin (sff)
T. Kingfisher A Wizard's Guide to Defensive Baking (sff)
T. Kingfisher Nine Goblins (sff)
Michael Lewis The Fifth Risk (nonfiction)
Paul McAuley War of the Maps (sff)
Gretchen McCulloch Because Internet (nonfiction)
Hayao Miyazaki Nausica of the Valley of the Wind (graphic novel)
Annalee Newitz The Future of Another Timeline (sff)
Nick Pettigrew Anti-Social (nonfiction)
Rivers Solomon, et al. The Deep (sff)
Jo Walton Or What You Will (sff)
Erik Olin Wright Stardust to Stardust (nonfiction) Of these, I've already read and reviewed The Fifth Risk (an excellent book).

25 July 2020

Craig Small: 25 Years of Free Software

When did I start writing Free Software, now called Open Source? That s a tricky question. Does the time start with the first file edited, the first time it compiles or perhaps even some proto-program you use to work out a concept for the real program formed later on. So using the date you start writing, especially in a era before decent version control systems, is problematic. That is why I use the date of the first release of the first package as the start date. For me, that was Monday 24th July 1995. axdigi and before My first released Free Software program was axdigi which was a layer-2 packet repeater for hamradio. This was uploaded to some FTP server, probably UCSD in late July 1995. The README is dated 24th July 1995. There were programs before this. I had written a closed-source (probably undistributable) driver for the Gracilis PackeTwin serial card and also some sort of primitive wireshark/tcpdump thing for capturing packet radio. Funny thing is that the capture program is the predecessor of both axdigi and a system that was used by a major Australian ISP for their internet billing system. Choosing Free Software So you have written something you think others might like, what software license will you use to distribute it? In 1995 it wasn t that clear. This was the era of strange boutique licenses including ones where it was ok to run the program as a hamradio operator but not a CB radio operator (or at least they tried to work it that way). A friend of mine and the author of the Linux HAM HOWTO amongst other documents, Terry Dawson, suggested I use GPL or another Free Software license. He explained what this Free Software thing was and said that if you want your program to be the most useful then something like GPL will do it. So I released axdigi under the GPL license and most of my programs since then have used the same license. Something like MIT or BSD licenses would have been fine too, I was just not going to use something closed or hand-crafted. That was a while ago, I ve written or maintained many programs since then. I also became a Debian maintainer (23 years so far) and adopted both procps and psmisc which I still maintain as both the Debian developer and upstream to this day. What Next? So it has been 25 years or a quarter of a century, what will happen next? Probably more of the same, though I m not sure I will be maintaining Free Software by the end of the next 25 years (I ll be over 70 then). Perhaps the singularity will arrive and writing software will be something people only do at Rennie Festivals. Come to the Festival! There is someone making horseshoes! Other there is a steam engine. See this other guy writing computer programs on a thing called keyboard!

30 June 2020

Craig Sanders: Fuck Grey Text

fuck grey text on white backgrounds
fuck grey text on black backgrounds
fuck thin, spindly fonts
fuck 10px text
fuck any size of anything in px
fuck font-weight 300
fuck unreadable web pages
fuck themes that implement this unreadable idiocy
fuck sites that don t work without javascript
fuck reactjs and everything like it thank fuck for Stylus. and uBlock Origin. and uMatrix. Fuck Grey Text is a post from: Errata

29 April 2020

Craig Small: Sending data in a signal

The well-known kill system call has been around for decades and is used to send a signal to another process. The most common use is to terminate or kill another process by sending the KILL or TERM signal but it can be used for a form of IPC, usually around giving the other process a kick to do something. One thing that isn t as well known is besides sending a signal to a process, you can send some data to it. This can either be an integer or a pointer and uses similar semantics to the known kill and signal handler. I came across this when there was a merge request for procps. The main changes are using sigqueue instead of kill in the sender and using a signal action not a signal handler in the receiver. To illustrate this feature, I have a small set of programs called sender and receiver that will pass an integer between them. The Sender The sender program is extremely simple, use a random(ish) from time masked to two bytes, put it in the required union and send the lot to sendqueue.
# include <signal.h>
# include <stdlib.h>
# include <stdio.h>
# include <time.h>
int main(int argc, char **argv)
 
    union sigval sigval;
    pid_t pid;
    if (argc < 2   (pid = atoi(argv[1])) < 0)
	return EXIT_FAILURE;
    sigval.sival_int = time(NULL) &amp; 0xff;
    printf("sender: sending %d to PID %d\n",
        sigval.sival_int, pid);
    sigqueue(pid, SIGUSR1, sigval);
    return EXIT_SUCCESS;
 
The key lines are 13 and 16 where the random (ish) integer is stored in the sigval union and then sent to the other process with the sigqueue. The receiver The receiver just sets up the signal handler, sends its PID (so I know what to tell the sender) and sits in a sleeping loop.
# include <stdio.h>
# include <stdlib.h>
# include <sys/types.h>
# include <unistd.h>
# include <signal.h>
void signal_handler(int signum, siginfo_t *siginfo, void *ucontext)
 
    if (signum != SIGUSR1) return;
    if (siginfo->si_code != SI_QUEUE) return;
    printf("receiver: Got value %d\n",
	    siginfo->si_int);
 
int main(int argc, char **argv)
 
    pid_t pid = getpid();
    struct sigaction signal_action;
    printf("receiver: PID is %d\n", pid);
    signal_action.sa_sigaction = signal_handler;
    sigemptyset (&amp;signal_action.sa_mask);
    signal_action.sa_flags = SA_SIGINFO;
    sigaction(SIGUSR1, &amp;signal_action, NULL);
    while(1) sleep(100);
    return EXIT_SUCCESS;
 
Lines 16-26 setup the signal handler. The main difference here is SA_SIGINFO used for the signal flags and sigaction references a sa_sigaction function rather than sa_handler. We need to use a different function because the sigaction only is passed the signal number but we need more information, including the integer that the sender process stored in sigval. Lines 7-14 are the signal handler function itself. It first checks that the receiver process got the correct signal (SIGUSR1 in this case) and that we got this signal from sigqueue because the type is SI_QUEUE. Checking the type of signal is important because different signals give you different data. For example, if you signalled this process with kill then si_int is undefined. The result As a proof of concept, the results are not terribly exciting. We see the sender say what it will be sending and the receiver saying it got it. It was useful to get some results, especially when things went wrong.
$ ./receiver &amp;
[1] 370216
receiver: PID is 370216
$ ./sender 370216
sender: sending 133 to (gdPID 370216
receiver: Got value 133
Gotchas While testing the two process there was two gotchas I encountered. GDB and the siginfo structure The sigaction manual page shows a simple siginfo_t structure, however when looking at what is passed to the signal handler, it s much more complicated.
(gdb) p *siginfo
$2 =  si_signo = 10, si_errno = 0, si_code = -1, __pad0 = 0, _sifields =  _pad =  371539, 1000, 11, 32766, 0 <repeats 24 times> , _kill =  si_pid = 371539, si_uid = 1000 , _timer =  si_tid = 371539, 
      si_overrun = 1000, si_sigval =  sival_int = 11, sival_ptr = 0x7ffe0000000b , _rt =  si_pid = 371539, si_uid = 1000, si_sigval =  sival_int = 11, sival_ptr = 0x7ffe0000000b , _sigchld =  
      si_pid = 371539, si_uid = 1000, si_status = 11, si_utime = 0, si_stime = 0 , _sigfault =  si_addr = 0x3e80005ab53, si_addr_lsb = 11, _bounds =  _addr_bnd =  _lower = 0x0, _upper = 0x0 , _pkey = 0 , 
    _sigpoll =  si_band = 4294967667539, si_fd = 11 , _sigsys =  _call_addr = 0x3e80005ab53, _syscall = 11, _arch = 32766 
(gdb) p siginfo->_sifields._rt.si_sigval.sival_int
$3 = 11
So the integer is stored in a union in a structure in a structure. Much harder to find than just simply sival_int. The pointer is just a pointer So perhaps sending an integer is not enough. The sigval is a union with an integer and a pointer. Could a string be sent instead? I changed line 13 of the sender so it used a string instead of an integer.
    sigval.sival_ptr = "Hello, World!"
The receiver needed a minor adjustment to print out the string. I tried this and the receiver segmentation faulted. What was going on? The issue is the set of system calls does a simple passing of the values. So if the sender sends a pointer to a string located at 0x1234567 then the receiver will have a pointer to the same location. When the receiver tries to dereference the sival_ptr, it is pointing to memory that is not owned by it but by another process (the sender) so it segmentation faults. The solution would be to use shared memory between the processes. The signal queue would then use the pointer to the shared memory and, in theory, all would be well.

Next.