On 22nd of October 2004 an event called
OS04 took place in Seifenfabrik Graz/Austria and it marked the first official release of the
Grml project.
Grml was initially started by myself in 2003 I registered the domain on September 16, 2003 (so technically it would be 11 years already :)). It started with a boot-disk, first created by hand and then based on
yard. On 4th of October 2004 we had a first presentation of grml 0.09 Codename Bughunter at Kunstlabor in Graz.
I managed to talk a good friend and fellow student Martin Hecher into joining me. Soon after Michael Gebetsroither and Andreas Gredler joined and throughout the upcoming years further team members (Nico Golde, Daniel K. Gebhart, Mario Lang, Gerfried Fuchs, Matthias Kopfermann, Wolfgang Scheicher, Julius Plenz, Tobias Klauser, Marcel Wichern, Alexander Wirt, Timo Boettcher, Ulrich Dangel, Frank Terbeck, Alexander Steinb ck, Christian Hofstaedtler) and contributors (Hermann Thomas, Andreas Krennmair, Sven Guckes, Jogi Hofm ller, Moritz Augsburger, ) joined our efforts.
Back in those days most efforts went into hardware detection, loading and setting up the according drivers and configurations, packaging software and fighting bugs with lots of reboots (working on our custom /linuxrc for the initrd wasn t always fun). Throughout the years virtualization became more broadly available, which is especially great for most of the testing you need to do when working on your own (meta) distribution. Once upon a time udev became available and solved most of the hardware detection issues for us. Nowadays X.org doesn t even need a xorg.conf file anymore (at least by default). We have to acknowledge that Linux grew up over the years quite a bit (and I m wondering how we ll look back at the systemd discussions in a few years).
By having Debian Developers within the team we managed to push quite some work of us back to
Debian (the distribution Grml was and still is based on), years before the
Debian Derivatives initiative appeared. We never stopped contributing to Debian though and we also still benefit from the Debian Derivatives initiative, like sharing issues and ideas on
DebConf meetings. On 28th of May 2009 I myself became an official Debian Developer.
Over the years we moved from private self-hosted infrastructure to company-sponsored systems, migrated from Subversion (brr) to Mercurial (2006) to Git (2008). Our Zsh-related work became widely known as
grml-zshrc.
jenkins.grml.org managed to become a continuous integration/deployment/delivery home e.g. for the dpkg, fai, initramfs-tools, screen and zsh Debian packages. The underlying software for creating Debian packages in a
CI/
CD way became its own project known as
jenkins-debian-glue in August 2011. In 2006 I started
grml-debootstrap, which grew into a reliable method for installing plain Debian (nowadays even supporting installation as VM, and one of my customers does tens of deployments per day with grml-debootstrap in a fully automated fashion). So one of the biggest achievements of Grml is from my point of view that it managed to grow several active and successful sub-projects under its umbrella.
Nowadays the
Grml team consists of 3 Debian Developers Alexander Wirt (formorer), Evgeni Golov (Zhenech) and myself. We couldn t talk Frank Terbeck (ft) into becoming a DM/DD (yet?), but he s an active part of our Grml team nonetheless and does a terrific job with maintaining grml-zshrc as well as helping out in Debian s Zsh packaging (and being a Zsh upstream committer at the same time makes all of that even better :)).
My personal conclusion for 10 years of Grml? Back in the days when I was a student Grml was my main personal pet and hobby. Grml grew into an open source project which wasn t known just in Graz/Austria, but especially throughout the German system administration scene. Since 2008 I m working self-employed and mainly working on open source stuff, so I m kind of living a dream, which I didn t even have when I started with Grml in 2003. Nowadays with running my own business and having my own family it s getting harder for me to consider it still a hobby though, instead it s more integrated and part of my business which I personally consider both good and bad at the same time (for various reasons).
Thanks so much to anyone of you, who was (and possibly still is) part of the Grml journey! Let s hope for another 10 successful years!
Thanks to Max Amanshauser and Christian Hofstaedtler for reading drafts of this.
 I also created a
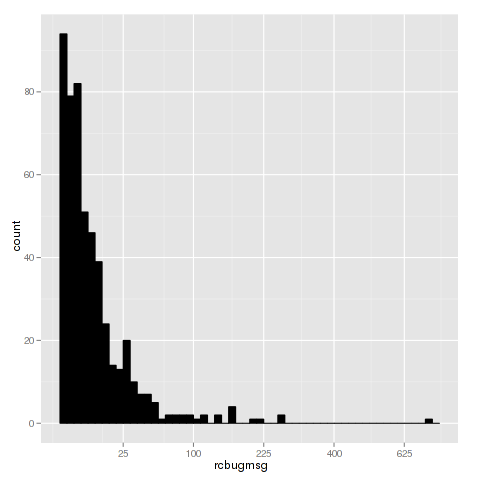
  As the first and third quantile are close together we can assume that the majority of the work is done by a few, especially since the second quantile is 5. This is supported by the histogram below, where the x axis is the number of recorded messages and y is the number of developers.