Dominique Dumont: How I investigated connection hogs on Kubernetes
Hi
My name is Dominhique Dumont, DevOps freelance in Grenoble, France.
My goal is to share my experience regarding a production issue that occurred last week where my client complained that the applications was very slow and sometime showed 5xx errors. The production service is hosted on a Kubernetes cluster on Azure and use a MongoDB on ScaleGrid.
I reproduced the issue on my side and found that the API calls were randomly failing due to timeouts on server side.
The server logs were showing some MongoDB disconnections and reconnections and some time-out on MongoDB connections, but did not give any clue on why some connections to MongoDB server were failing.
Since there was not clue in the cluster logs, I looked at ScaleGrid monitoring. There was about 2500 connections on MongoDB: 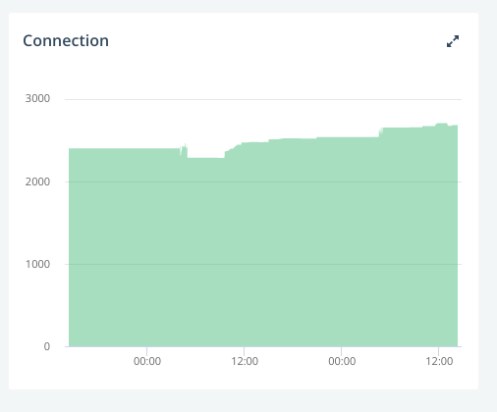 That seemed quite a lot given the low traffic at that time, but not necessarily a problem.
Then, I went to the Azure console, and I got the first hint about the origin of the problem: the SNATs were exhausted on some nodes of the clusters.
That seemed quite a lot given the low traffic at that time, but not necessarily a problem.
Then, I went to the Azure console, and I got the first hint about the origin of the problem: the SNATs were exhausted on some nodes of the clusters. 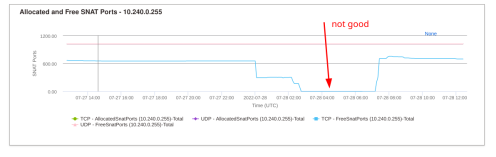 SNATs are involved in connections from the cluster to the outside world, i.e. to our MongoDB server and are quite limited: only 1024 SNAT ports are available per node. This was consistent with the number of used connections on MongoDB.
OK, then the number of used connections on MongoDB was a real problem.
The next question was: which pods and how many connections ?
First I had to filter out the pods that did not use MongoDB. Fortunately, all our pods have labels so I could list all pods using MongoDB:
SNATs are involved in connections from the cluster to the outside world, i.e. to our MongoDB server and are quite limited: only 1024 SNAT ports are available per node. This was consistent with the number of used connections on MongoDB.
OK, then the number of used connections on MongoDB was a real problem.
The next question was: which pods and how many connections ?
First I had to filter out the pods that did not use MongoDB. Fortunately, all our pods have labels so I could list all pods using MongoDB:
That seemed quite a lot given the low traffic at that time, but not necessarily a problem.
Then, I went to the Azure console, and I got the first hint about the origin of the problem: the SNATs were exhausted on some nodes of the clusters.
SNATs are involved in connections from the cluster to the outside world, i.e. to our MongoDB server and are quite limited: only 1024 SNAT ports are available per node. This was consistent with the number of used connections on MongoDB.
OK, then the number of used connections on MongoDB was a real problem.
The next question was: which pods and how many connections ?
First I had to filter out the pods that did not use MongoDB. Fortunately, all our pods have labels so I could list all pods using MongoDB:
$ kubectl -n prod get pods -l db=mongo   wc -l
236
Hmm, still quite a lot. Next problem is to check which pod used too many MongoDB connections. Unfortunately, the logs mentioned that a connection to MongoDB was opened, but that did not give a clue on how many were used. Netstat is not installed on the pods, and cannot be installed since the pods are running as root (which is a good idea for security reasons) Then, my Debian Developer experience kicked in and I remembered that
/proc file system on Linux gives a lot of information on consumed kernel resources, including resources consumed by each process.
The trick is to know the PID of the process using the connections.
In our case, Docker files are written in a way so the main process of a pod using NodeJS is 1, so, the command to list the connections of pod is:
$ kubectl -n prod exec redacted-pod-name-69875496f8-8bj4f -- cat /proc/1/net/tcp
  sl  local_address rem_address   st tx_queue rx_queue tr tm->when retrnsmt   uid  timeout inode
   0: AC00F00A:C9FA C2906714:6989 01 00000000:00000000 02:00000DA9 00000000  1001        0 376439162 2 0000000000000000 21 4 0 10 -1
   1: AC00F00A:CA00 C2906714:6989 01 00000000:00000000 02:00000E76 00000000  1001        0 376439811 2 0000000000000000 21 4 0 10 -1
   2: AC00F00A:8ED0 C2906714:6989 01 00000000:00000000 02:000004DA 00000000  1001        0 445806350 2 0000000000000000 21 4 30 10 -1
   3: AC00F00A:CA02 C2906714:6989 01 00000000:00000000 02:000000DD 00000000  1001        0 376439812 2 0000000000000000 21 4 0 10 -1
   4: AC00F00A:C9FE C2906714:6989 01 00000000:00000000 02:00000DA9 00000000  1001        0 376439810 2 0000000000000000 21 4 0 10 -1
   5: AC00F00A:8760 C2906714:6989 01 00000000:00000000 02:00000810 00000000  1001        0 375803096 2 0000000000000000 21 4 0 10 -1
   6: AC00F00A:C9FC C2906714:6989 01 00000000:00000000 02:00000DA9 00000000  1001        0 376439809 2 0000000000000000 21 4 0 10 -1
   7: AC00F00A:C56C C2906714:6989 01 00000000:00000000 02:00000DA9 00000000  1001        0 376167298 2 0000000000000000 21 4 0 10 -1
   8: AC00F00A:883C C2906714:6989 01 00000000:00000000 02:00000734 00000000  1001        0 375823415 2 0000000000000000 21 4 30 10 -1
OK, that s less appealing that netstat output. The trick is that rem_address and port are expressed in hexa. A quick calculation confirms the port
0x6989 is indeed port 27017, which is the listening port of MongoDB server.
So the number of opened MongoDB connections is given by:
$ kubectl -n prod exec redacted-pod-name-69875496f8-8bj4f -- cat /proc/1/net/tcp   grep :6989   wc -l
9
What s next ? The ideal solution would be to fix the NodeJS code to handle correctly the termination of the connections, but that would have taken too long to develop. So I ve written a small Perl script to:
- list the pods using MongoDB using
kubectl -n prod get pods -l db=mongo - find the pods using more that 10 connections using the
kubectl execcommand shown above - compute the deployment name of these pods (which was possible given the naming convention used with our pods and deployments)
- restart the deployment of these pods with a
kubectl rollout restart deploymentcommand
- the monitoring tools provided by the hosting services.
- a good knowledge of Linux internals
- consistent labels on our pods
- the naming conventions used for our kubernetes artifacts


 I used AKS to setup a cluster for my first client as a
 Ouch
Ouch  My first reflex was to reduce the amount of logs produced by all our
 Should we be worried about our database credentials which are, legacy
 And we don t need it because our environment variables do not change.
Well, it s now time to fix these issues.
And we don t need it because our environment variables do not change.
Well, it s now time to fix these issues.  We re going to:


 What happened about the


