Search Results: "Dima Kogan"

26 January 2024

Dima Kogan: mrcal 2.4 released!

mrcal 2.4 is out: the release notes. Once again, this is mostly a bug-fix release en route to the big new features coming in 3.0. The most noteworthy fixes: The portability work was motivated by Matt Morley, who was interested in integrating mrcal into PhotonVision, the toolkit used by students in the FIRST Robotics Competition. Matt completed that work, and mrcal is now a part of PhotonVision 2024.1.2! Thanks, Matt! I don't know if there will be a mrcal 2.5, but the next interesting release will be mrcal 3.0. The biggest internal rework is complete: the new cross-reprojection uncertainty quantification method is implemented, tested and documented. The results are very promising, but lots needs to happen before we can reliably compute intrinsics without chessboards and produce full SFM solves in mrcal and all the related things.

7 December 2023

Dima Kogan: roslanch and =LD_PRELOAD=

This is part 2 of our series entitled "ROS people don't know how to use computers". This is about ROS1. ROS2 is presumably broken in some completely different way, but I don't know. Unlike normal people, the ROS people don't "run" applications. They "launch" "nodes" from "packages" (these are "ROS" packages; obviously). You run
roslaunch PACKAGE THING.launch
Then it tries to find this PACKAGE (using some rules that nobody understands), and tries to find the file THING.launch within this package. The .launch file contains inscrutable xml, which includes other inscrutable xml. And if you dig, you eventually find stuff like
<node pkg="PACKAGE"
      name="NAME"
      type="TYPE"
      args="...."
      ...>
This defines the thing that runs. Unexpectedly, the executable that ends up running is called TYPE. I know that my particular program is broken, and needs an LD_PRELOAD (exciting details described in another rant in the near future). But the above definition doesn't have a clear way to add that. Adding it to the type fails (with a very mysterious error message). Reading the docs tells you about launch-prefix, which sounds exactly like what I want. But when I add LD_PRELOAD=/tmp/whatever.so I get
RLException: Roslaunch got a 'No such file or directory' error while attempting to run:
LD_PRELOAD=/tmp/whatever.so ..../TYPE .....
But this is how you're supposed to be attaching gdb and such! Presumably it looks at the first token, and makes sure it's a file, instead of simply prepending it to the string it passes to the shell. So your options are: I'm expert-enough. You do this:
launch-prefix="/lib64/ld-linux-x86-64.so.2 --preload /tmp/whatever.so"

26 October 2023

Dima Kogan: Talking to ROS from outside a LAN

The problem
This is about ROS version 1. Version 2 is different, and maybe they fixed stuff. But I kinda doubt it since this thing is heinous in a million ways. Alright so let's say we have have some machines in a LAN doing ROS stuff and we have another machine outside the LAN that wants to listen in (like to get a realtime visualization, say). This is an extremely common scenario, but they created enough hoops to make this not work. Let's say we have 3 computers:
  • router: the bridge between the two networks. This has two NICs. The inner IP is 10.0.1.1 and the outer IP is 12.34.56.78
  • inner: a machine in the LAN that's doing ROS stuff. IP 10.0.1.99
  • outer: a machine outside that LAN that wants to listen in. IP 12.34.56.99
Let's say the router is doing ROS stuff. It's running the ROS master and some nodes like this:
ROS_IP=10.0.1.1 roslaunch whatever
If you omit the ROS_IP it'll pick router, which may or may not work, depending on how the DNS is set up. Here we set it to 10.0.1.1 to make it possible for the inner machine to communicate (we'll see why in a bit). An aside: ROS should use the IP by default instead of the name because the IP will work even if the DNS isn't set up. If there are multiple extant IPs, it should throw an error. But all that would be way too user-friendly. OK. So we have a ROS master on 10.0.1.1 on the default port: 11311. The inner machine can rostopic echo and all that. Great. What if I try to listen in from outer? I say
ROS_MASTER_URI=http://12.34.56.78:11311 rostopic list
This connects to the router on that port, and it works well: I get the list of available topics. Here this works because the router is the router. If inner was running the ROS master then we'd need to do a forward for port 11311. In any case, this works and we understand it. So clearly we can talk to the ROS master. Right? Wrong! Let's actually listen in on a specific topic on outer:
ROS_MASTER_URI=http://12.34.56.78:11311 rostopic echo /some/topic
This does not work. No errors are reported. It just sits there, which looks like no data is coming in on that topic. But this is a lie: it's actually broken.

The diagnosis
So this is our problem. It's a very common use case, and there are plenty of internet people asking about it, with no specific solutions. I debugged it, and the details are here. To figure out what's going on, I made a syscall log on a machine inside the LAN, where a simple rostopic echo does work:
sysdig -A proc.name=rostopic and fd.type contains ipv -s 2000
This shows us all the communication between inner running rostopic and the server. It's really chatty. It's all TCP. There are multiple connections to the router on port 11311. It also starts up multiple TCP servers on the client that listen to connections; these are likely to be broken if we were running the client on outer and a machine inside the LAN tried to talk to them; but thankfully in my limited testing nothing actually tried to talk to them. The conversations on port 11311 are really long, but here's the punchline. inner tells the router:
POST /RPC2 HTTP/1.1                                                                                                                 
Host: 10.0.1.1:11311                                                                                                          
Accept-Encoding: gzip                                                                                                               
Content-Type: text/xml                                                                                                              
User-Agent: Python-xmlrpc/3.11                                                                                                      
Content-Length: 390                                                                                                                 
<?xml version='1.0'?>
<methodCall>
<methodName>registerSubscriber</methodName>
<params>
<param>
<value><string>/rostopic_2447878_1698362157834</string></value>
</param>
<param>
<value><string>/some/topic</string></value>
</param>
<param>
<value><string>*</string></value>
</param>
<param>
<value><string>http://inner:38229/</string></value>
</param>
</params>
</methodCall>
Yes. It's laughably chatty. Then the router replies:
HTTP/1.1 200 OK
Server: BaseHTTP/0.6 Python/3.8.10
Date: Thu, 26 Oct 2023 23:15:28 GMT
Content-type: text/xml
Content-length: 342
<?xml version='1.0'?>
<methodResponse>
<params>
<param>
<value><array><data>
<value><int>1</int></value>
<value><string>Subscribed to [/some/topic]</string></value>
<value><array><data>
<value><string>http://10.0.1.1:45517/</string></value>
</data></array></value>
</param>
</params>
</methodResponse>
Then this sequence of system calls happens in the rostopic process (an excerpt from the sysdig log):
> connect fd=10(<4>) addr=10.0.1.1:45517
< connect res=-115(EINPROGRESS) tuple=10.0.1.99:47428->10.0.1.1:45517 fd=10(<4t>10.0.1.99:47428->10.0.1.1:45517)
< getsockopt res=0 fd=10(<4t>10.0.1.99:47428->10.0.1.1:45517) level=1(SOL_SOCKET) optname=4(SO_ERROR) val=0 optlen=4
So the inner client makes an outgoing TCP connection on the address given to it by the ROS master above: 10.0.1.1:45517. This IP is only accessible from within the LAN, which works fine when talking to it from inner, but would be a problem from the outside. Furthermore, some sort of single-port-forwarding scheme wouldn't fix connecting from outer either, since the port number is dynamic. To confirm what we think is happening, the sequence of syscalls when trying to rostopic echo from outer does indeed fail:
connect fd=10(<4>) addr=10.0.1.1:45517 
connect res=-115(EINPROGRESS) tuple=10.0.1.1:46204->10.0.1.1:45517 fd=10(<4t>10.0.1.1:46204->10.0.1.1:45517)
getsockopt res=0 fd=10(<4t>10.0.1.1:46204->10.0.1.1:45517) level=1(SOL_SOCKET) optname=4(SO_ERROR) val=-111(ECONNREFUSED) optlen=4
That's the breakage mechanism: the ROS master asks us to communicate on an address we can't talk to. Debugging this is easy with sysdig:
sudo sysdig -A -s 400 evt.buffer contains '"Subscribed to"' and proc.name=rostopic
This prints out all syscalls seen by the rostopic command that contain the string Subscribed to, so you can see that different addresses the ROS master gives us in response to different commands. OK. So can we get the ROS master to give us an address that we can actually talk to? Sorta. Remember that we invoked the master with
ROS_IP=10.0.1.1 roslaunch whatever
The ROS_IP environment variable is exactly the address that the master gives out. So in this case, we can fix it by doing this instead:
ROS_IP=12.34.56.78 roslaunch whatever
Then the outer machine will be asked to talk to 12.34.56.78:45517, which works. Unfortunately, if we do that, then the inner machine won't be able to communicate. So some sort of ssh port forward cannot fix this: we need a lower-level tunnel, like a VPN or something. And another rant. Here rostopic tried to connect to an unreachable address, which failed. But rostopic knows the connection failed! It should throw an error message to the user. Something like this would be wonderful:
ERROR! Tried to connect to 10.0.1.1:45517 ($ROS_IP:dynamicport), but connect() returned ECONNREFUSED
That would be immensely helpful. It would tell the user that something went wrong (instead of no data being sent), and it would give a strong indication of the problem and how to fix it. But that would be asking too much.
The solution
So we need a VPN-like thing. I just tried sshuttle, and it just works. Start the ROS node in the way that makes connections from within the LAN work:
ROS_IP=10.0.1.1 roslaunch whatever
Then on the outer client:
sshuttle -r router 10.0.1.0/24
This connects to the router over ssh and does some hackery to make all connections from outer to 10.0.1.x transparently route into the LAN. On all ports. rostopic echo then works. I haven't done any thorough testing, but hopefully it's reliable and has low overhead; I don't know. I haven't tried it but almost certainly this would work even with the ROS master running on inner. This would be accomplished like this:
  1. Tell ssh how to connect to inner. Dropping this into ~/.ssh/config should do it:
    Host inner
    HostName 10.0.1.99
    ProxyJump router
    
  2. Do the magic thing:
    sshuttle -r inner 10.0.1.0/24
    
I'm sure any other VPN-like thing would work also.

5 May 2023

Dima Kogan: mrcal 2.3 released!

Today I released mrcal 2.3 (the release notes are available here). Once again, in the code there are lots of useful improvements, but nothing major. The big update in this release is the documentation. Much of it was improved and extended, especially practical guides in the how-to-calibrate page and the recipes. Major updates are imminent. I'm about to merge the cross-projection uncertainty branch and the triangulated-points-in-the-solver branch to study chessboard-less calibrations and structure from motion. Neither of these are novel, but mrcal's improved lens models and uncertainty propagation will hopefully produce better results.

20 April 2023

Dima Kogan: =numpy.percentile= API update

The numpy devs did a bad thing. Don't be like the numpy devs. The current (version 1.24) docs for numpy.percentile say this about the method keyword argument:
Changed in version 1.22.0: This argument was previously called "interpolation" ...
They renamed a keyword argument. So if you had working code that did
np.percentile( ...., interpolation=xxx, ....)
then running it in the most recent numpy would throw lots of Deprecation warnings at you, and presumably eventually it will stop working completely. This isn't great. The obvious answer is to change the code to
np.percentile( ...., method=xxx, ....)
But then if you run it on a machine with an older numpy install, then it won't work at all! There isn't a trivial method for users of numpy to conform to this change without breaking stuff. In other words, the numpy devs gave their users pointless homework. I just did this homework with this commit to mrcal. It creates a percentile_compat() function that figures out which flavor of argument we should use, and uses it. Here it is:
def percentile_compat(*args, **kwargs):
    r'''Wrapper for np.percentile() to handle their API change
In numpy 1.24 the "interpolation" kwarg was renamed to "method". I need to pass
the right thing to work with both old and new numpy. This function tries the
newer method, and if that fails, uses the old one. The test is only done the
first time.
It is assumed that this is called with the old 'interpolation' key.
    '''
    if not 'interpolation' in kwargs or \
       percentile_compat.which == 'interpolation':
        return np.percentile(*args, **kwargs)
    kwargs_no_interpolation = dict(kwargs)
    del kwargs_no_interpolation['interpolation']
    if percentile_compat.which == 'method':
        return np.percentile(*args, **kwargs_no_interpolation,
                             method = kwargs['interpolation'])
    # Need to detect
    try:
        result = np.percentile(*args, **kwargs_no_interpolation,
                               method = kwargs['interpolation'])
        percentile_compat.which = 'method'
        return result
    except:
        percentile_compat.which = 'interpolation'
        return np.percentile(*args, **kwargs)
percentile_compat.which = None
Please take it and use it. I give up all copyright.

13 March 2023

Dima Kogan: Debian at SCaLE 20x

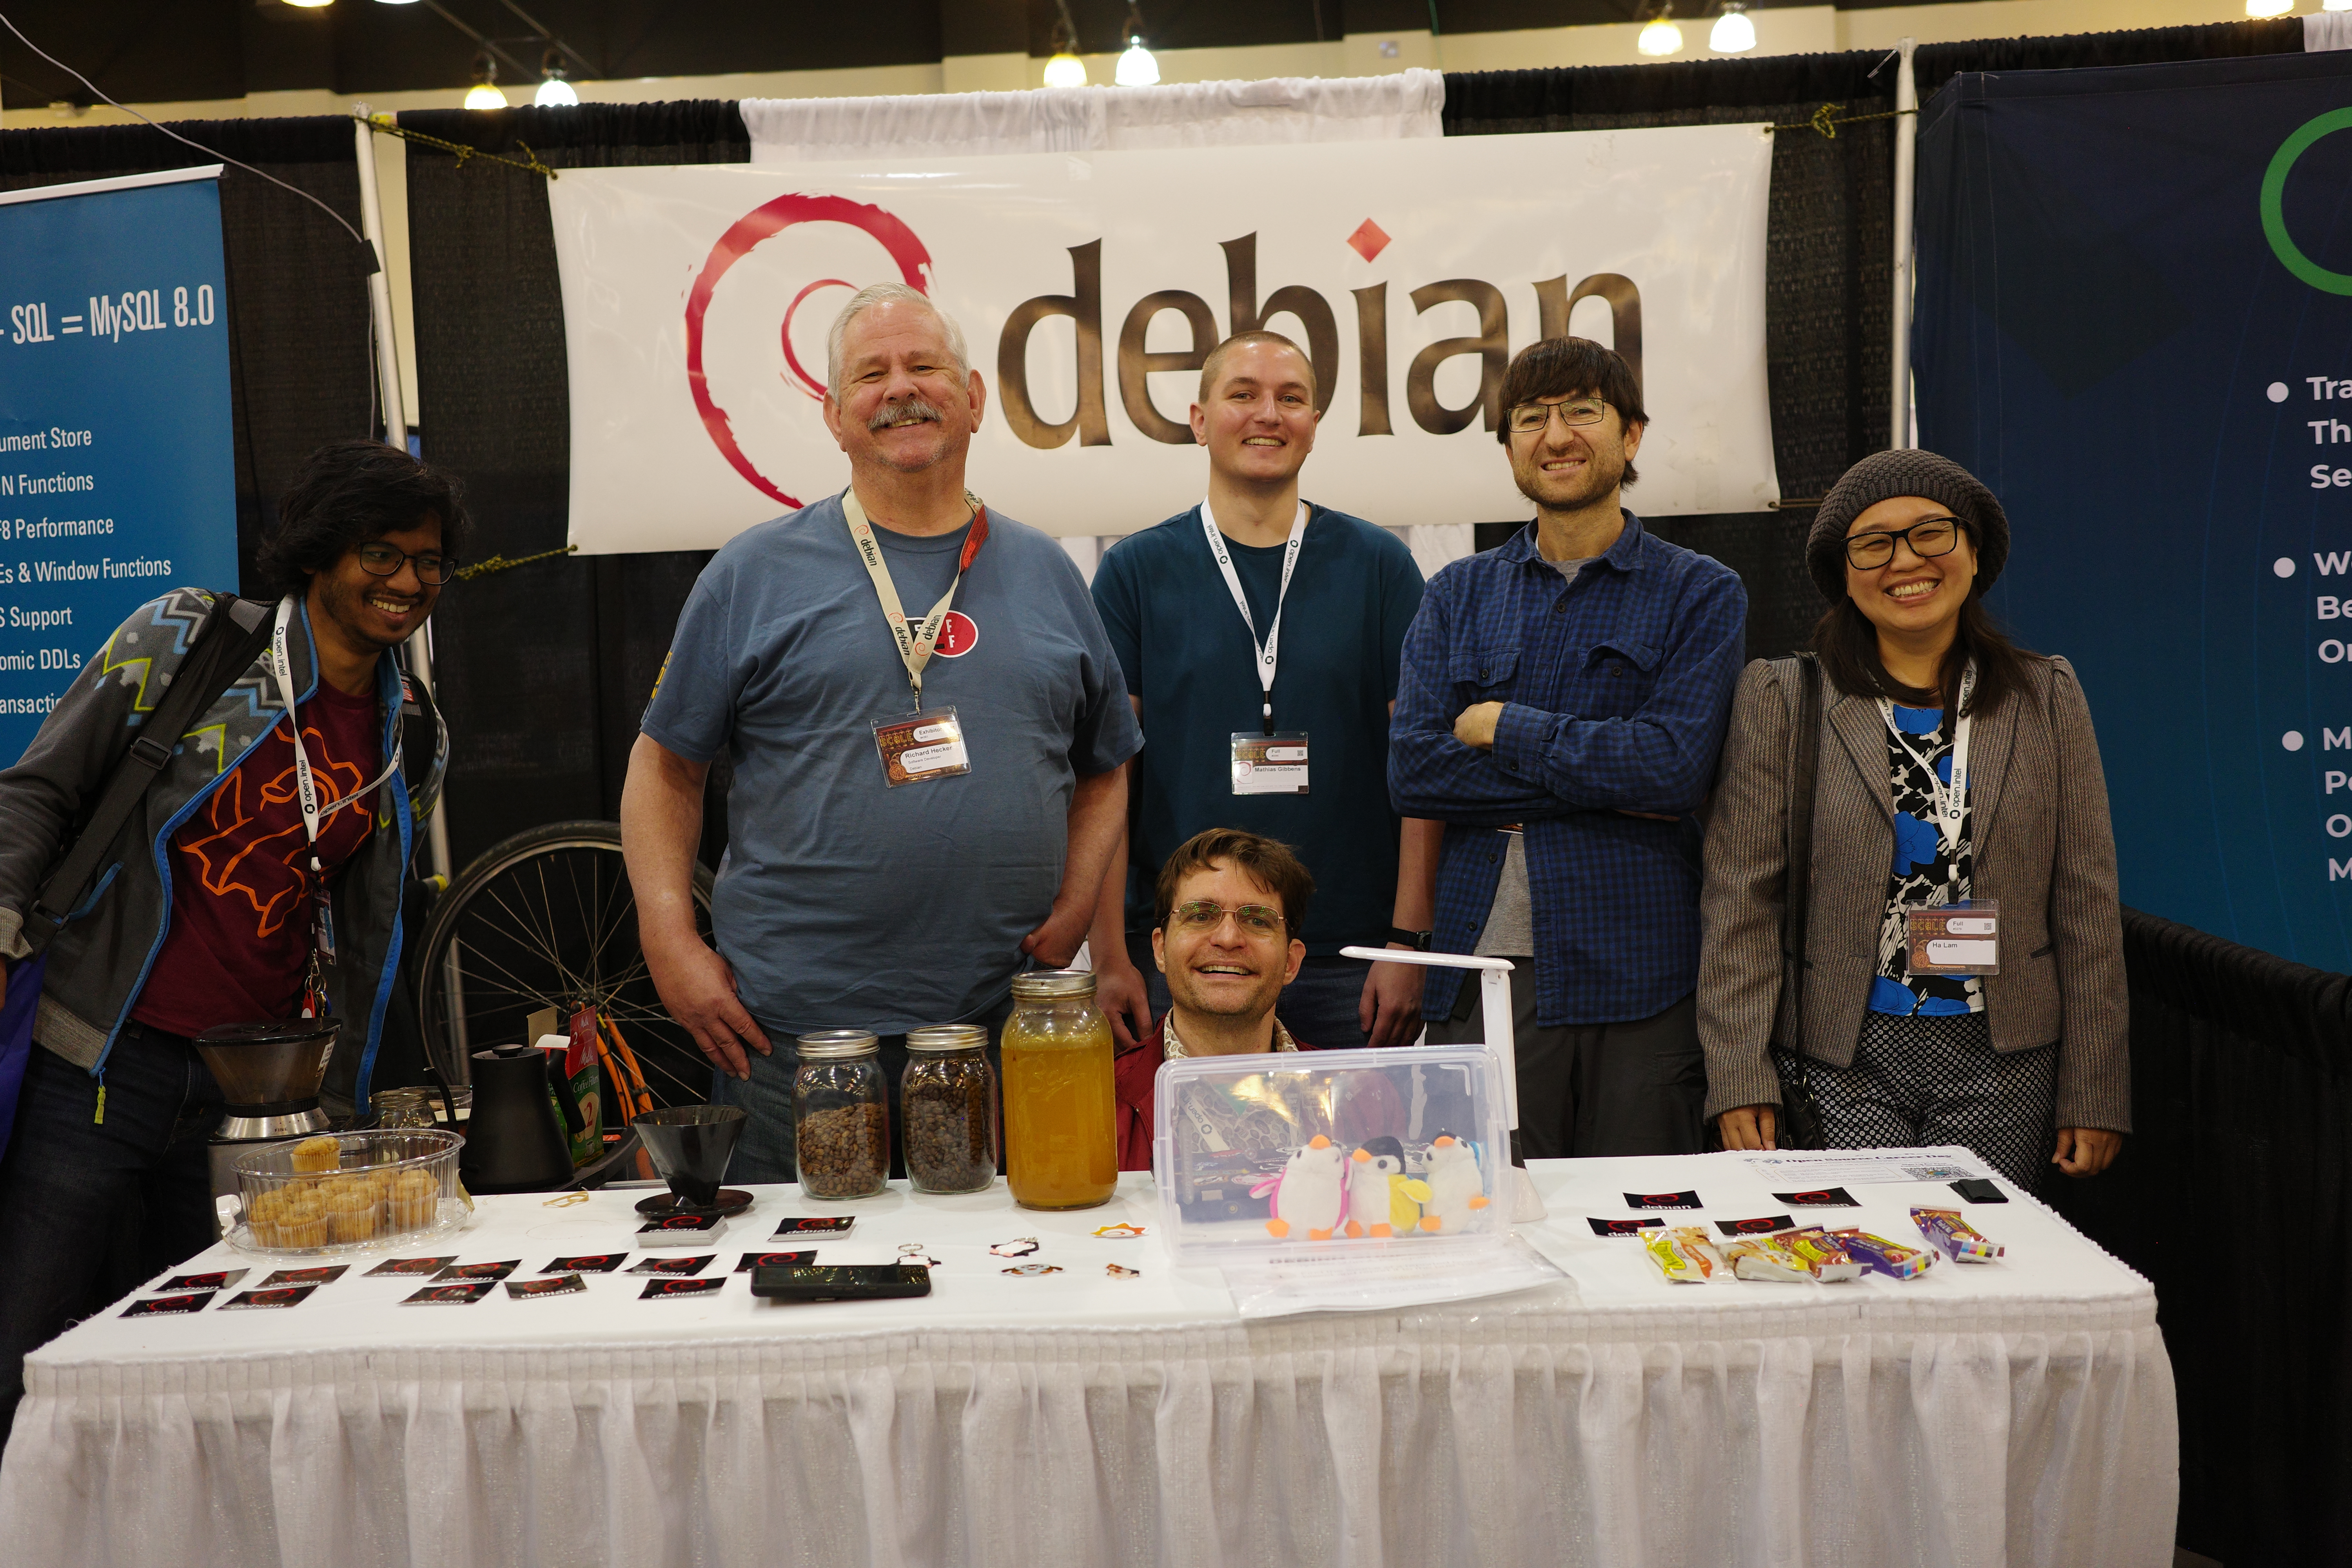
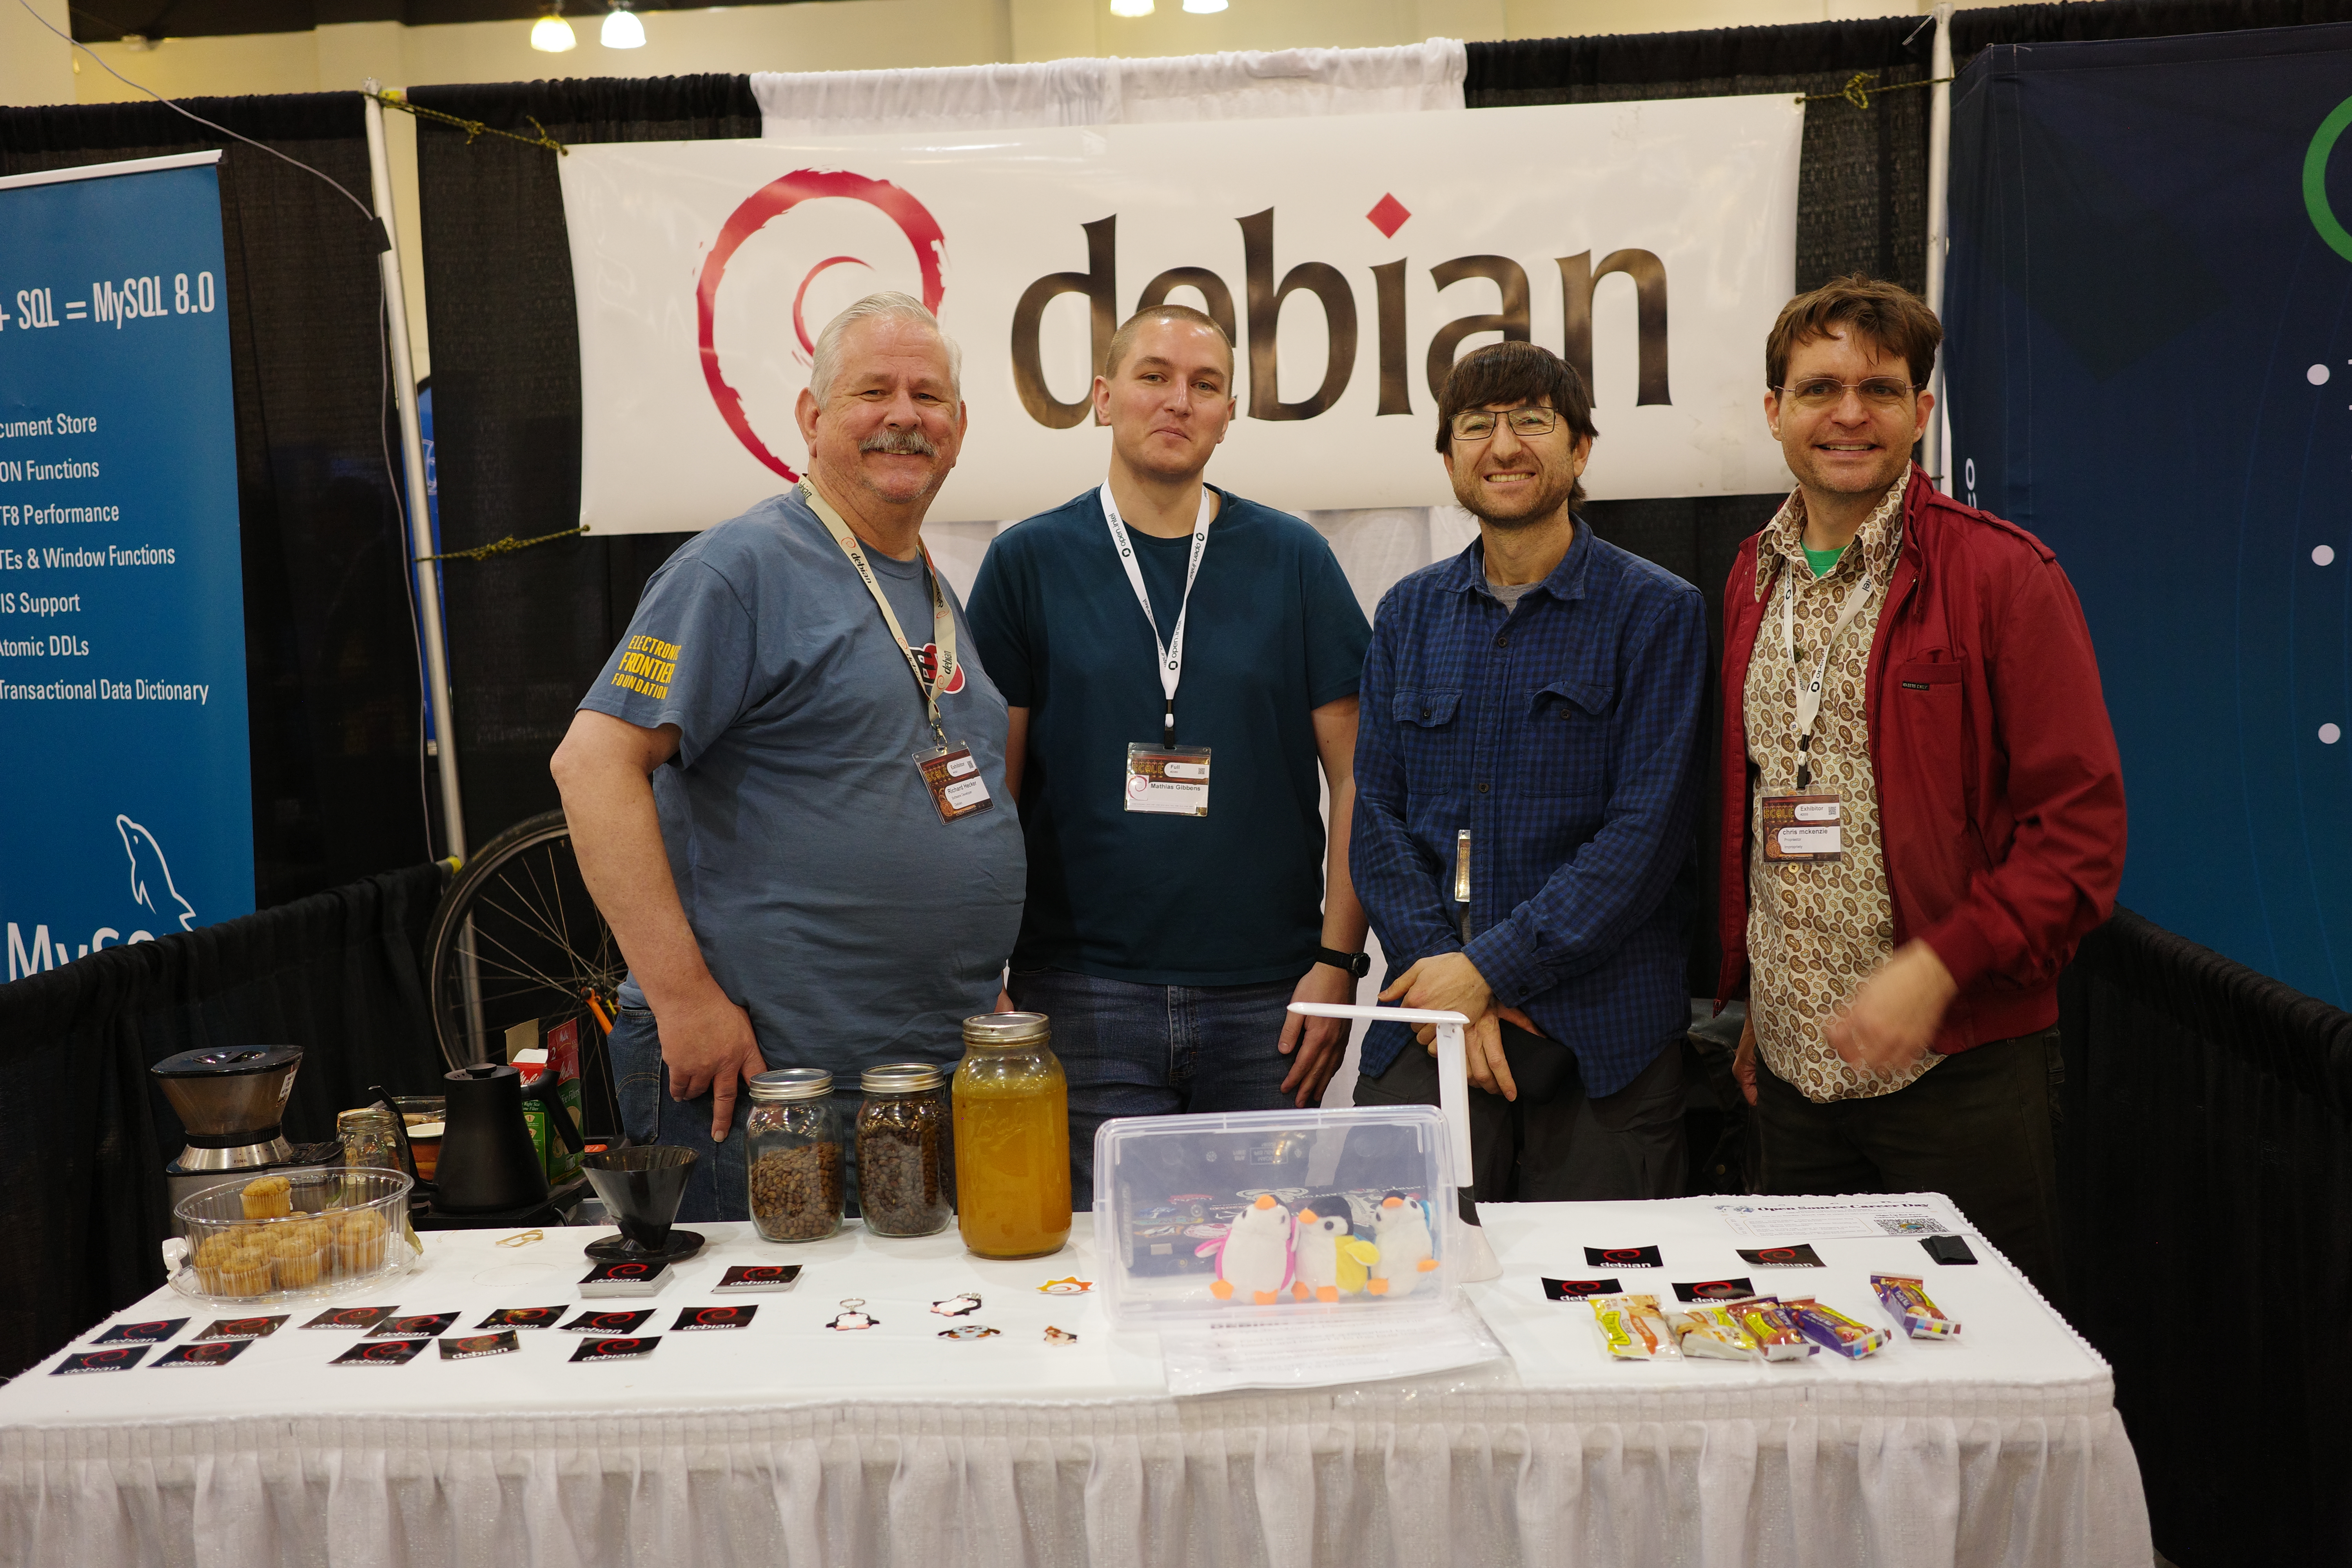
SCaLE 20x just wrapped up. We spent three days running the Debian booth: passing out stickers, penguin swag, coffee and cookies, and telling everyone that would listen about about our great OS. As usual, Richard Hecker, Chris McKenzie and I attended as the "LA Debian contingent". Mathias Gibbens flew in from Albuquerque, and Ha Lam and Syed Reza stopped by periodically. Chris created extra demand by restricting the supply of plushy penguins. Some kid was shocked at my old laptop, only to see Mathias pull out an even older one. And we finished off the conference by listening to Ken Thompson's tale about his music collection. Good times. The crew:
R0003400.jpg
R0003423.jpg
Looking forward to next year!

17 October 2022

Dima Kogan: gnuplot output in an FLTK widget

Overview
I make a lot of plots, and the fragmentation of tools in this space really bugs me. People writing Python code mostly use matplotlib, R people use ggplot2. MS people use the internal Excel thing. I've seen people use gtkdatabox for GTK widgets, rrdtool for logging, qcustomplot for qt. And so on. This is really unhelpful, and it would benefit everybody if there was a single solid plotting backend with lots of bindings to different languages and tools. For my own usage, I've been fighting this quixotic battle, using gnuplot as the plotting backend for all my use cases. gnuplot is
  • very mature
  • stable
  • fast
  • powerful
  • supported on every (with reason) platform
  • supports lots and lots of output backends
There are some things it can't do, but those can be added, and I haven't felt it to be limiting in over 20 years of using it. I rarely use it directly, and usually interact with it through one of I wrote all of these, although the Perl library was taken over by others long ago. Recently I needed a plotting widget for an FLTK program written in Python. It would be great if there was a C++ class deriving from Fl_Widget that would be wrapped by pyfltk, but there isn't. But it turns out that I already had all the tools to quickly hack together something that mostly works. This is a not-ready-for-primetime hack, but it works so well, I'd like to write it up. Hopefully this will be done "properly" someday.

Approach
Alright. So here I'm trying to tie together a Python program, gnuplot output and an FLTK widget. This is a Python program, I can use gnuplotlib to talk to the gnuplot backend. In a perfect world, gnuplot would ship a backend interfacing to FLTK. But it doesn't. What it does do is to ship an x11 backend that makes plots with X11 commands, and it allows these commands to be directed to an arbitrary X11 window. So we
  1. Make an FLTK widget that simply creates an X11 window, and never actually draws into it
  2. Tell gnuplot to plot into this window

Demo
This is really simple, and works shockingly well. Here's my Fl_gnuplotlib widget:
#!/usr/bin/python3
import sys
import gnuplotlib as gp
import fltk
class Fl_Gnuplotlib_Window(fltk.Fl_Window):
    def __init__(self, x,y,w,h, **plot_options):
        super().__init__(x,y,w,h)
        self.end()
        self._plot                 = None
        self._delayed_plot_options = None
        self.init_plot(**plot_options)
    def init_plot(self, **plot_options):
        if 'terminal' in plot_options:
            raise Exception("Fl_Gnuplotlib_Window needs control of the terminal, but the user asked for a specific 'terminal'")
        if self._plot is not None:
            self._plot = None
        self._delayed_plot_options = None
        xid = fltk.fl_xid(self)
        if xid == 0:
            # I don't have an xid (yet?), so I delay the init
            self._delayed_plot_options = plot_options
            return
        # will barf if we already have a terminal
        gp.add_plot_option(plot_options,
                           terminal = f'x11 window "0x xid:x "')
        self._plot = gp.gnuplotlib(**plot_options)
    def plot(self, *args, **kwargs):
        if self._plot is None:
            if self._delayed_plot_options is None:
                raise Exception("plot has not been initialized")
            self.init_plot(**self._delayed_plot_options)
            if self._plot is None:
                raise Exception("plot has not been initialized. Delayed initialization failed")
        self._plot.plot(*args, **kwargs)
Clearly it's simply making an Fl_Window, and pointing gnuplotlib at it. And a sample application that uses this widget:
#!/usr/bin/python3
import sys
import numpy as np
import numpysane as nps
from fltk import *
from Fl_gnuplotlib import *
window = Fl_Window(800, 600, "plot")
plot   = Fl_Gnuplotlib_Window(0, 0, 800,600)
iplot = 0
plotx = np.arange(1000)
ploty = nps.cat(plotx*plotx,
                np.sin(plotx/100),
                plotx)
def timer_callback(*args):
    global iplot, plotx, ploty, plot
    plot.plot(plotx,
              ploty[iplot],
              _with = 'lines')
    iplot += 1
    if iplot == len(ploty):
        iplot = 0
    Fl.repeat_timeout(1.0, timer_callback)
window.resizable(window)
window.end()
window.show()
Fl.add_timeout(1.0, timer_callback)
Fl.run()
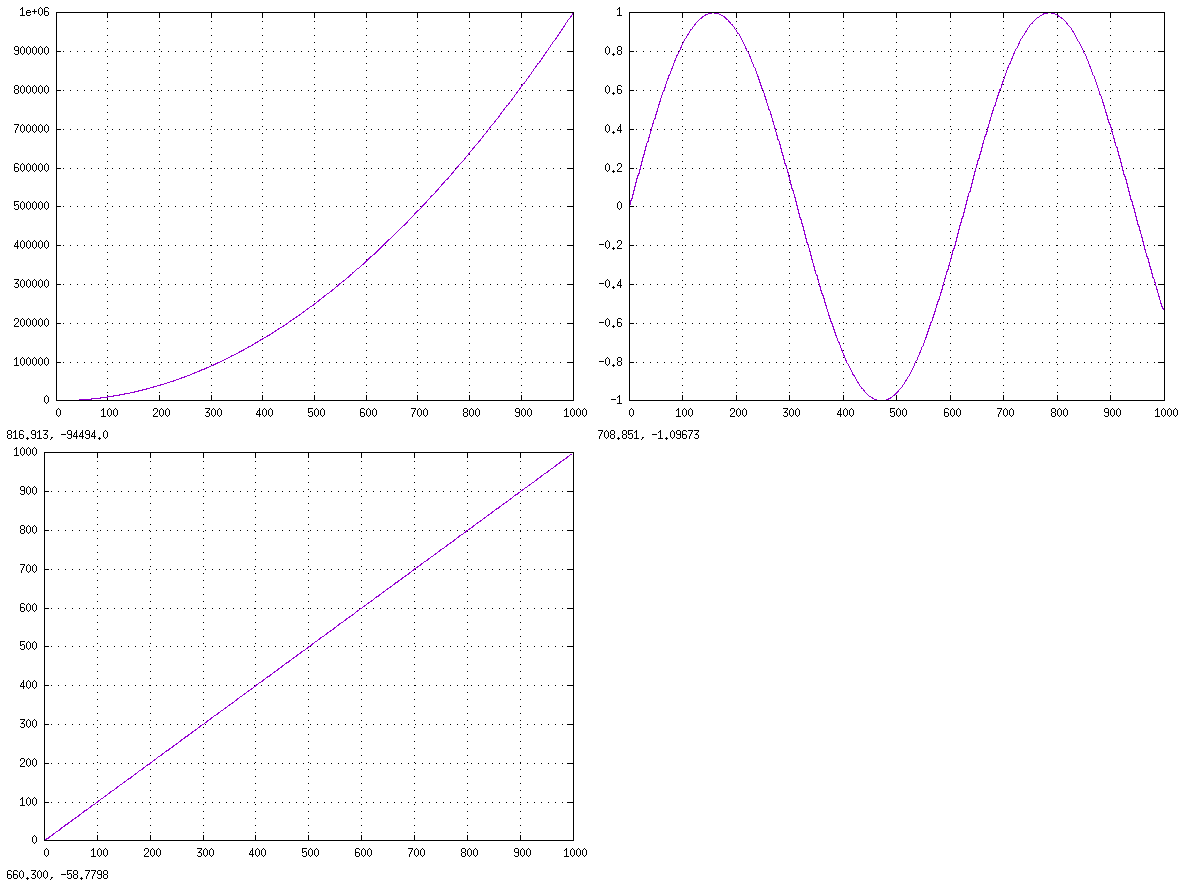
This is nice and simple. Exactly what a program using a widget to make a plot (while being oblivious to the details) should look like. It creates a window, places the one plotting widget into it, and cycles the plot inside it at 1Hz (cycling between a parabola, a sinusoid and a line). Clearly we could place other UI elements around it, or add more plots, or whatever. The output looks like this:
Fl_gnuplotlib_demo.gif
To run you need to apt install python3-numpysane python3-gnuplotlib python3-fltk. If running an older distro on a non-Debian-based distro, you should grab those from source.

Discussion
This works. But it's a hack. Some issues:
  • This plotting widget currently can output only. It can make whatever plot we like, but it cannot accept UI input from the container program in any way
  • More than that, when focused it completely replaces the FLTK event logic for that window. So all keyboard input is swallowed, including the keys to access FLTK menus, to exit the application, etc, etc.
  • This approach requires us to use the x11 gnuplot terminal. This works, but it's no longer the terminal preferred by the gnuplot devs, and it it's maintained as vigilantly as the others.
  • And it has bugs. For instance, asking to plot into a window that doesn't yet exist, causes it to create a new window. This breaks FLTK applications that start up and create a plot immediately. Here's a mailing list thread discussing these issues.
So this is a very functional hack, but it's still hack. And it feels like making this solid will take a lot of work. Maybe. I'll push more on this as I need it. Stay tuned!

4 October 2022

Dima Kogan: mrcal 2.2 released

Today I released mrcal 2.2 (the release notes are available here). This release contains lots of medium-important internal improvements, and is a result of The biggest single new feature in this release is the interactive graphical tool for examining dense stereo results: accessed via mrcal-stereo --viz stereo. The next pressing thing is improved documentation. The tour of mrcal is still a good overview of some of the functionality that makes mrcal unique and far better than traditional calibration tools. But it doesn't do a good job of demonstrating how you would actually use mrcal to diagnose and handle common calibration issues. I need to gather some releasable representative data, and write docs around that. Then I'm going to start finishing the big new features in the roadmap (these are all already functional, but need polish):

28 June 2022

Dima Kogan: vnlog 1.33 released

This is a minor release to the vnlog toolkit that adds a few convenience options to the vnl-filter tool. The new options are

vnl-filter -l
Prints out the existing columns, and exits. I've been low-level wanting this for years, but never acutely-enough to actually write it. Today I finally did it.

vnl-filter --sub-abs
Defines an absolute-value abs() function in the default awk mode. I've been low-level wanting this for years as well. Previously I'd use --perl just to get abs(), or I'd explicitly define it: = sub 'abs(x) return x>0?x:-x; '=. Typing all that out was becoming tiresome, and now I don't need to anymore.

vnl-filter --begin ... and vnl-filter --end ...
Theses add BEGIN and END clauses. They're useful to, for instance, use a perl module in BEGIN, or to print out some final output in END. Previously you'd add these inside the --eval block, but that was awkward because BEGIN and END would then appear inside the while(<>) loop. And there was no clear was to do it in the normal -p mode (no --eval). Clearly these are all minor, since the toolkit is now mature. It does everything I want it to, that doesn't require lots of work to implement. The big missing features that I want would patch the underlying GNU coreutils instead of vnlog:
  • The sort tool can select different sorting modes, but join works only with alphanumeric sorting. join should have similarly selectable sorting modes. In the vnlog wrappe I can currently do something like vnl-join --vnl-sort n. This would pre-sort the input alphanumerically, and then post-sort it numerically. That is slow for big datasets. If join could handle numerically-sorted data directly, neither the pre- or post-sorts would be needed
  • When joining on a numerical field, join should be able to do some sort of interpolation when given fields that don't match exactly.
Both of these probably wouldn't take a ton of work to implement, and I'll look into it someday.

16 June 2022

Dima Kogan: Ricoh GR IIIx 802.11 reverse engineering

I just got a fancy new camera: Ricoh GR IIIx. It's pretty great, and I strongly recommend it to anyone that wants a truly pocketable camera with fantastic image quality and full manual controls. One annoyance is the connectivity. It does have both Bluetooth and 802.11, but the only official method of using them is some dinky closed phone app. This is silly. I just did some reverse-engineering, and I now have a functional shell script to download the last few images via 802.11. This is more convenient than plugging in a wire or pulling out the memory card. Fortunately, Ricoh didn't bend over backwards to make the reversing difficult, so to figure it out I didn't even need to download the phone app, and sniff the traffic. When you turn on the 802.11 on the camera, it says stuff about essid and password, so clearly the camera runs its own access point. Not ideal, but it's good-enough. I connected, and ran nmap to find hosts and open ports: only port 80 on 192.168.0.1 is open. Pointing curl at it yields some error, so I need to figure out the valid endpoints. I downloaded the firmware binary, and tried to figure out what's in it:
dima@shorty:/tmp$ binwalk fwdc243b.bin
DECIMAL       HEXADECIMAL     DESCRIPTION
--------------------------------------------------------------------------------
3036150       0x2E53F6        Cisco IOS microcode, for "8"
3164652       0x3049EC        Certificate in DER format (x509 v3), header length: 4, sequence length: 5412
5472143       0x537F8F        Copyright string: "Copyright ("
6128763       0x5D847B        PARity archive data - file number 90
10711634      0xA37252        gzip compressed data, maximum compression, from Unix, last modified: 2022-02-15 05:47:23
13959724      0xD5022C        MySQL ISAM compressed data file Version 11
24829873      0x17ADFB1       MySQL MISAM compressed data file Version 4
24917663      0x17C369F       MySQL MISAM compressed data file Version 4
24918526      0x17C39FE       MySQL MISAM compressed data file Version 4
24921612      0x17C460C       MySQL MISAM compressed data file Version 4
24948153      0x17CADB9       MySQL MISAM compressed data file Version 4
25221672      0x180DA28       MySQL MISAM compressed data file Version 4
25784158      0x1896F5E       Cisco IOS microcode, for "\"
26173589      0x18F6095       MySQL MISAM compressed data file Version 4
28297588      0x1AFC974       MySQL ISAM compressed data file Version 6
28988307      0x1BA5393       MySQL ISAM compressed data file Version 3
28990184      0x1BA5AE8       MySQL MISAM index file Version 3
29118867      0x1BC5193       MySQL MISAM index file Version 3
29449193      0x1C15BE9       JPEG image data, JFIF standard 1.01
29522133      0x1C278D5       JPEG image data, JFIF standard 1.08
29522412      0x1C279EC       Copyright string: "Copyright ("
29632931      0x1C429A3       JPEG image data, JFIF standard 1.01
29724094      0x1C58DBE       JPEG image data, JFIF standard 1.01
The gzip chunk looks like what I want:
dima@shorty:/tmp$ tail -c+10711635 fwdc243b.bin> /tmp/tst.gz
dima@shorty:/tmp$ < /tmp/tst.gz gunzip   file -
/dev/stdin: ASCII cpio archive (SVR4 with no CRC)
dima@shorty:/tmp$ < /tmp/tst.gz gunzip > tst.cpio
OK, we have some .cpio thing. It's plain-text. I grep around it in, looking for GET and POST and such, and I see various URI-looking things at /v1/..... Grepping for that I see
dima@shorty:/tmp$ strings tst.cpio   grep /v1/
GET /v1/debug/revisions
GET /v1/ping
GET /v1/photos
GET /v1/props
PUT /v1/params/device
PUT /v1/params/lens
PUT /v1/params/camera
GET /v1/liveview
GET /v1/transfers
POST /v1/device/finish
POST /v1/device/wlan/finish
POST /v1/lens/focus
POST /v1/camera/shoot
POST /v1/camera/shoot/compose
POST /v1/camera/shoot/cancel
GET /v1/photos/ / 
GET /v1/photos/ / /info
PUT /v1/photos/ / /transfer
/v1/photos/<string>/<string>
/v1/photos/<string>/<string>/info
/v1/photos/<string>/<string>/transfer
/v1/device/finish
/v1/device/wlan/finish
/v1/lens/focus
/v1/camera/shoot
/v1/camera/shoot/compose
/v1/camera/shoot/cancel
/v1/changes
/v1/changes message received.
/v1/changes issue event.
/v1/changes new websocket connection.
/v1/changes websocket connection closed. reason( )
/v1/transfers, transferState( ), afterIndex( ), limit( )
Jackpot. I pointed curl at most of these, and they do interesting things. Generally they all spit out JSON. /v1/liveview sends out a sequence of JPEG images. The thing I care about is /v1/photos/DIRECTORY/FILE and /v1/photos/DIRECTORY/FILE/info. The result is a script I just wrote to connect to the camera, download N images, and connect back to the original access point: https://github.com/dkogan/ricoh-download Kinda crude, but works for now. I'll improve it with time. After I did this I found an old thread from 2015 where somebody was using an apparently-compatible camera, and wrote a fancier tool: https://www.pentaxforums.com/forums/184-pentax-k-s1-k-s2/295501-k-s2-wifi-laptop-2.html

29 November 2021

Dima Kogan: GL_image_display

I just spent an unspeakable number of days typing to produce something that sounds very un-impressive: an FLTK widget that can display an image. The docs and code live here. The big difference from the usual image-drawing widget is that this one uses OpenGL internally, so after the initial image load, the common operations (drawing, redrawing, panning and zooming) are very fast. I have high-resolution images in my projects, and this will make my tools much nicer. Three separate interfaces are available: The FLTK widgets have built-in interactive panning/zooming, and the library can draw line overlays. So nice applications can be built quickly. I already added some early disabled-by-default support into the mrcal-stereo tool to visualize the rectification and report sensitivities:
widget.png
Nice!

8 November 2021

Dima Kogan: mrcal 2.0: triangulation and stereo

mrcal is my big toolkit for geometric computer vision: making models (camera calibration) and using models (mapping, ranging, etc). Since the release of mrcal 1.0 back in February I've been busy using the tools in the field, fixing things and improving things. Today I'm happy to finally be able to announce the release of mrcal 2.0. A big part of this release is maintenance and cleanup that resulted from me heavily using the tools over the course of this past year, and improving whatever was bugging me. The most notable result of that effort, is that splined models are no longer "experimental". They work well and they're awesome. Go try them. And there're a number of new features, most notably nice dense stereo support and nice sparse triangulation support (with uncertainty propagation!) These are awesome. Go try them. As before, the tour of mrcal provides a good overview of the capabilities of the toolkit, and is a good place to start reading the documentation. Reading these docs would be very illuminating for anybody that calibrates cameras, even for those that have no intent to actually use the mrcal tools. Let me know if you try it out! The most list of most notable improvements, from the release notes:

13 March 2021

Dima Kogan: Making the Supernova E3 tail light brighter

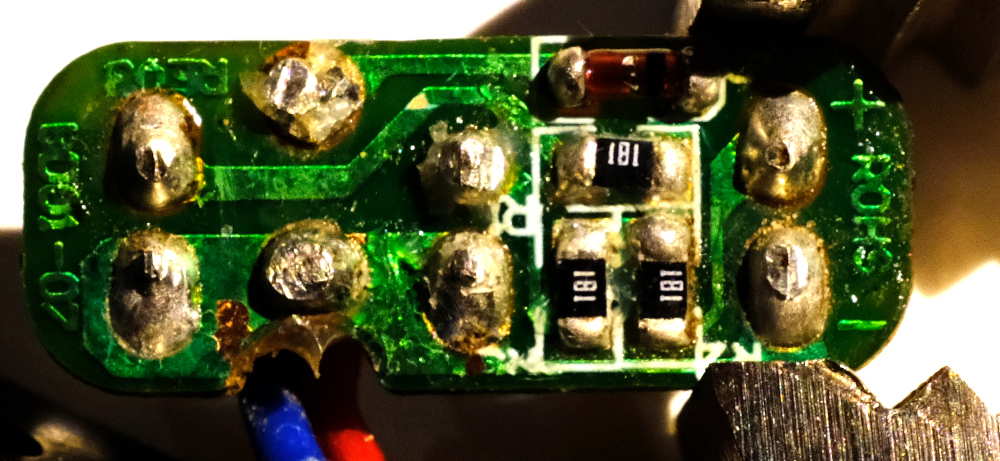
I got a dynamo hub for my bike and a fancy headlight. It's sweet, but I'm discovering that there're no standards for making tail lights work, so I just had to do some light reverse-engineering and soldering. And this is the findings. Different manufacturers do tail lights differently. Most tail lights are not connected directly to the dynamo, but to the headlight instead. Busch+M ller tail lights take an AC signal that looks very similar to what the hub is producing. You're not supposed to hook it up to the hub directly, but it does appear to work, and it's not clear how the headlight's tail-light output is different from the hub input. I haven't scoped it. Supernova tail lights work differently. Some guy on the internet reverse-engineered the headlight circuit showing an LM317 regulator producing 5.9V for the tail light. I have a Supernova E3 tail light (original one; model E161). The case says "6V", which is close to the 5.9V they give it. It wants its 6V, but I don't have a Supernova headlight, so I don't have 6V to give it. I do have a USB charger, so I have 5V instead. Giving it 5V does appear to work, but that results in less brightness than I would like. Presumably the voltage difference is to blame? I took apart the tail light. The circuitry is encased in hot glue. Scraping that off, we can see the action:
before.jpg
The circuit looks like this:
e3.svg
More or less, this is as expected. The circuit was designed to receive 6V, so the resistances (180 ohms) were selected to produce a certain amount of current. Given 5V, there's less current and less brightness. I can fix this by reducing the amount of resistance to bring the current levels up. I hooked up a power supply to produce 5V and 5.9V, and I measured the voltages in the circuit in those two states. Assume little accuracy in all of this
5V 5.9V
V across input diode 0.8V 0.8V
V across the resistors 2.37V 3.25V
V across the LEDs 1.83V 1.85V
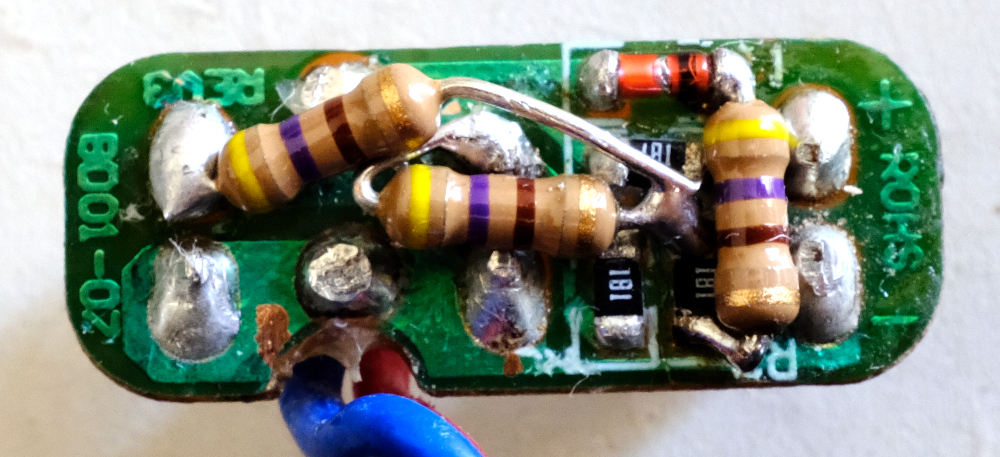
As expected, the voltages across the diodes are stable, and the resistors see the bulk of the voltage difference. The circuit designers wanted 3.25/180 ~ 18mA. With my reduced voltage I was getting 2.37/180 ~ 13mA instead. So I was 28% less bright than I should have been. That doesn't sound like a lot, but it's hard to tell by just looking at the thing. In any case, I can reduce the resistances to get the higher current at 5V: I want a resistance R of 180/3.25*2.37 ~ 131 ohms. In the interest of doing less work, I simply added more resistors in parallel instead of replacing the existing ones. So I need to add in parallel a resistance R such that 180R/(180+R) = 131. So I want a parallel R ~ 485 ohms. Looking through my box of parts, I don't have any nice surface-mount resistors with anywhere near the right resistance. But I do have through-hole ones at 470 ohms. Close-enough. I did some soldering gymnastics:
after.jpg
And I'm done. Haven't done any night rides outside yet with this setup, but in theory this should be bright-enough. And since the resistors are just burning off the excess voltage, and I'm giving it less voltage to burn off, I'm being more efficient than I would have been with 6V and the stock resistors.

28 February 2021

Dima Kogan: mrcal: principled camera calibrations

This is a big deal. In my day job I work with images captured by cameras, using those images to infer something about the geometry of the scene being observed. Naturally, to get good results you need to have a good estimate of the behavior of the lens (the "intrinsics"), and of the relative geometry of the cameras (the "extrinsics"; if there's more than one camera). The usual way to do this is to perform a "calibration" procedure to compute the intrinsics and extrinsics, and then to use the resulting "camera model" to process the subsequent images. Wikipedia has an article. And from experience, the most common current toolkit to do this appears to be OpenCV. People have been doing this for a while, but for whatever reason the existing tools all suck. They make basic questions like "how much data should I gather for a calibration?" and "how good is this calibration I just computed?" and "how different are these two models?" unanswerable. This is clearly seen from the links above. The wikipedia article talks about fitting a pinhole model to lenses, even though no real lenses follow this model (telephoto lenses do somewhat; wider lenses don't at all). And the OpenCV tutorial cheerfully says that
Re-projection error gives a good estimation of just how exact the found
parameters are. The closer the re-projection error is to zero, the more accurate
the parameters we found are.
This statement is trivially proven false: throw away most of your calibration data, and your reprojection error becomes very low. But we can all agree that a calibration computed from less data is actually worse. Right? All the various assumptions and hacks in the existing tooling are fine as long as you don't need a whole lot of accuracy out of your results. I need a lot of accuracy, however, so all the existing tools don't work for my applications. So I built a new set of tools, and have been using them with great delight. I just got the blessing to do a public release, so I'm announcing it here. The tools are mrcal does a whole lot to produce calibrations that are as good as possible, and it will tell you just how good they are, and it includes visualization capabilities for extensive user feedback. An overview of the capabilities of the toolkit (with lots of pretty pictures!) is at the tour of mrcal. There's a lot of documentation and examples, but up to now I have been the primary user of the tools. So I expect this to be somewhat rough when others look at it. Bug reports and patches are welcome. mrcal is an excellent base, but it's nowhere near "done". The documentation has some notes about the planned features and improvements, and I'm always reachable by email. Let me know if you try it out!

27 February 2021

Dima Kogan: horizonator: terrain renderer based on SRTM DEMs

Check this out:
example-interactive.png
I just resurrected and cleaned up an old tool I had lying around. It's now nice and usable by others. This tool loads terrain data, and renders it from the ground, simulating what a human or a camera would see. This is useful for armchair exploring or for identifying peaks. This was relatively novel when I wrote it >10 years ago, but there are a number of similar tools in existence now. This implementation is still useful in that it's freely licensed and contains APIs, so fancier processing can be performed on its output. Sources and (barely-complete-enough) documentation live here: https://github.com/dkogan/horizonator

22 February 2021

Dima Kogan: feedgnuplot: labelled bar charts and a guide

I just released feedgnuplot 1.57, which includes two new pieces that I've long thought about adding:

Labelled bar charts
I've thought about adding these for a while, but had no specific need for them. Finally, somebody asked for it, and I wrote the code. Now that I can, I will probably use these all the time. The new capability can override the usual numerical tic labels on the x axis, and instead use text from a column in the data stream. The most obvious use case is labelled bar graphs:
echo "# label value
      aaa     2
      bbb     3
      ccc     5
      ddd     2"   \
feedgnuplot --vnl \
            --xticlabels \
            --with 'boxes fill solid border lt -1' \
            --ymin 0 --unset grid
xticlabels-basic.svg
But the usage is completely generic. All --xticlabels does, is to accept a data column as labels for the x-axis tics. Everything else that's supported by feedgnuplot and gnuplot works as before. For instance, I can give a domain, and use a style that takes y values and a color:
echo "# x label y color
        5 aaa   2 1
        6 bbb   3 2
       10 ccc   5 4
       11 ddd   2 1"   \
feedgnuplot --vnl --domain \
            --xticlabels \
            --tuplesizeall 3 \
            --with 'points pt 7 ps 2 palette' \
            --xmin 4 --xmax 12 \
            --ymin 0 --ymax 6 \
            --unset grid
xticlabels-points-palette.svg
And we can use gnuplot's support for clustered histograms:
echo "# x label a b
        5 aaa   2 1
        6 bbb   3 2
       10 ccc   5 4
       11 ddd   2 1"   \
vnl-filter -p label,a,b   \
feedgnuplot --vnl \
            --xticlabels \
            --set 'style data histogram' \
            --set 'style histogram cluster gap 2' \
            --set 'style fill solid border lt -1' \
            --autolegend \
            --ymin 0 --unset grid
xticlabels-clustered.svg
Or we can stack the bars on top of one another:
echo "# x label a b
        5 aaa   2 1
        6 bbb   3 2
       10 ccc   5 4
       11 ddd   2 1"   \
vnl-filter -p label,a,b   \
feedgnuplot --vnl \
            --xticlabels \
            --set 'style data histogram' \
            --set 'style histogram rowstacked' \
            --set 'boxwidth 0.8' \
            --set 'style fill solid border lt -1' \
            --autolegend \
            --ymin 0 --unset grid
xticlabels-stacked.svg
This is gnuplot's "row stacking". It also supports "column stacking", which effectively transposes the data, and it's not obvious to me that makes sense in the context of feedgnuplot. Similarly, it can label y and/or z axes; I can't think of a specific use case, so I don't have a realistic usage in mind, and I don't support that yet. If anybody can think of a use case, email me. Notes and limitations:
  • Since with --domain you can pass in both an x value and a tic label, it is possible to give it conflicting tic labels for the same x value. gnuplot itself has this problem too, and it just takes the last label it has for a given x. This is probably good-enough.
  • feedgnuplot uses whitespace-separated columns with no escape mechanism, so the field labels cannot have whitespace in it. Fixing this is probably not worth the effort.
  • These tic labels do not count towards the tuplesize
  • I really need to add a similar feature to gnuplotlib. This will happen when I need it or when somebody asks for it, whichever comes first.

A feedgnuplot guide
This fills in a sorely needed missing part of the documentation: the main feedgnuplot website now has a page containing examples and corresponding graphical output. This serves as a tutorial and a gallery demonstrating some usages. It's somewhat incomplete, since it can't show streaming plots, or real-world interfacing with stuff that produces data: some of those usages remain the the README. It's a million times better than what I had before though, which was nothing. Internally this is done just like the gnuplotlib guide: the thing is an org-mode document with org-babel snippets that are evaluated by emacs to make the images. There's some fancy emacs lisp to tie it all together. Works great!

29 July 2020

Dima Kogan: An awk corner case?

So even after years and years of experience, core tools still find ways to surprise me. Today I tried to do some timestamp comparisons with mawk (vnl-filter, to be more precise), and ran into a detail of the language that made it not work. Not a bug, I guess, since both mawk and gawk are affected. I'll claim "language design flaw", however. Let's say I'm processing data with unix timestamps in it (seconds since the epoch). gawk and recent versions of mawk have strftime() for that:
$ date
Wed Jul 29 15:31:13 PDT 2020
$ date +"%s"
1596061880
$ date +"%s"   mawk ' print strftime("%H",$1) '
15
And let's say I want to do something conditional on them. I want only data after 9:00 each day:
$ date +"%s"   mawk 'strftime("%H",$1) >= 9  print "Yep. After 9:00" '
That's right. No output. But it is 15:31 now, and I confirmed above that strftime() reports the right time, so it should know that it's after 9:00, but it doesn't. What gives? As we know, awk (and perl after it) treat numbers and strings containing numbers similarly: 5+5 and ="5"+5= both work the same, which is really convenient. This can only work if it can be inferred from context whether we want a number or a string; it knows that addition takes two numbers, so it knows to convert ="5"= into a number in the example above. But what if an operator is ambiguous? Then it picks a meaning based on some internal logic that I don't want to be familiar with. And apparently awk implements string comparisons with the same < and > operators, as numerical comparisons, creating the ambiguity I hit today. strftime returns strings, and you get silent, incorrect behavior that then demands debugging. How to fix? By telling awk to treat the output of strftime() as a number:
$ date +"%s"   mawk '0+strftime("%H",$1) >= 9  print "Yep. After 9:00" '
Yep. After 9:00
With the benefit of hindsight, they really should not have reused any operators for both number and string operations. Then these ambiguities wouldn't occur, and people wouldn't be grumbling into their blogs decades after these decisions were made.

23 July 2020

Dima Kogan: Finding long runs of "notable" data in a log

Here's yet another instance where the data processing I needed done could be acomplished entirely in the shell, with vnlog tools. I have some time-series data in a text table. Via some join and filter operations, I have boiled down this table to a sequence of time indices where something interesting happened. For instance let's say it looks like this: t.vnl
# time
1976
1977
1978
1979
1980
1986
1987
1988
1989
2011
2012
2013
2014
2015
4679
4680
4681
4682
4683
4684
4685
4686
4687
7281
7282
7283
7291
7292
7293
I'd like to find the longest contiguous chunk of time where the interesting thing kept happening. How? Like this!
$ < t.vnl vnl-filter -p 'time,d=diff(time)'  
          vnl-uniq -c -f -1  
          vnl-filter 'd==1' -p 'count=count+1,time=time-1'  
          vnl-sort -nrk count  
          vnl-align
# count time
9       4679
5       2011
5       1976
4       1986
3       7291
3       7281
Bam! So the longest run was 9-frames-long, starting at time = 4679.

18 July 2020

Dima Kogan: Converting images while extracting a tarball

Last week at the lab I received a data dump: a gzip-compressed tarball with lots of images in it. The images are all uncompressed .pgm, with the whole tarball weighing in at ~ 1TB. I tried to extract it, and after chugging all day, it ran out of disk space. Added more disk, tried again: out of space again. Just getting a listing of the archive contents (tar tvfz) took something like 8 hours. Clearly this is unreasonable. I made an executive decision to use .jpg files instead: I'd take the small image quality hit for the massive gains in storage efficiency. But the tarball has .pgm and just extracting the thing is challenging. So I'm now extracting the archive, and converting all the .pgm images to .jpg as soon as they hit disk. How? Glad you asked! I'm running two parallel terminal sessions (I'm using screen, but you can do whatever you like).

Session 1
< archive.tar.gz unpigz -p20   tar xv
Here I'm just extracting the archive to disk normally. Using unpigz instead of plain, old tar to get parallelization.

Session 2
inotifywait -r PATH -e close_write -m   mawk -Winteractive '/pgm$/   print $1$3  '   parallel -v -j10 'convert   -quality 96  . .jpg && rm  '
This is the secret sauce. I'm using inotifywait to tell me when any file is closed for writing in a subdirectory of PATH. Then I mawk it to only tell me when .pgm files are done being written, then I convert them to .jpg, and delete the .pgm when that's done. I'm using GNU Parallel to parallelize the image conversion. Otherwise the image conversion doesn't keep up. This is going to take at least all day, but I'm reasonably confident that it will actually finish successfully, and I can then actually do stuff with the data.

16 July 2020

Dima Kogan: Visualizing a broken internet connection

We've all seen our ISPs crap out periodically. Things feel slow, we then go ping some server, and see lost packets or slow response times. When bitching to the ISP it's useful to have evidence so you can clearly explain exactly how they are fucking up. This happened to me again last week, so I wrote a quick oneliner to do the visualization. Here it is:
( echo '# i dt'; ping 8.8.8.8   perl -ne 'BEGIN   $ =1  next if /PING/; s/.*seq=([0-9]+).*time=([0-9]+).*/\1 \2/ && print')   tee /tmp/ping.vnl   vnl-filter --stream -p i,dt,di='diff(i)'   vnl-filter --stream --has di   feedgnuplot  --domain --stream --with 'linespoints pt 7 palette' --tuplesizeall 3 --ymin 0 --set 'cbrange [1:]' --xlabel "ping index" --ylabel "Response time (ms)" --title "ping 8.8.8.8 response times. Consecutive indices shown as colors"
You run that, and you get a realtime-updating plot of ping times and missed packets. The one-liner also logs the data to a file, so the saved data can be re-visualized. Showing what happens on my currently-working internet connection:
< /tmp/ping.vnl vnl-filter -p i,dt,di='diff(i)'   vnl-filter --has di   feedgnuplot  --domain --with 'linespoints pt 7 palette' --tuplesizeall 3 --ymin 0 --set 'cbrange [1:]' --xlabel "ping index" --ylabel "Response time (ms)" --title "ping 8.8.8.8 response times. Consecutive indices shown as colors" --hardcopy /tmp/isp-good.svg
good.svg
On a broken network it looks like this (I edited the log to show the kind of broken-ness I was seeing earlier):
bad.svg
The x axis is the ping index. The y axis is the response time. Misses responses are shows as gaps in the points and also as colors, for legibility. As usual, this uses the vnlog and feedgnuplot tools, so
sudo apt install feedgnuplot vnlog
if you want to try this

Next.