
About a month ago, I
blogged
about
extremon. As a reminder, ExtreMon is a
monitoring tool that allows you to view things as they are happening,
rather than with the ~5 minute delay that munin gives you, and also
avoiding the quad-state limitation of Nagios' "good", "bad", "ugly",
and "unknown" states. No, they're not really called that. Yes, I know
you knew that.
Anyway. In my blog post, I explained how you can set up ExtreMon, and I
also set up a fairly limited demo version on my own server. But I have
since realized that while it is functional, it doesn't actually
show
why ExtreMon is so great. In an effort to remedy that, I present you an
example of what ExtreMon can do.
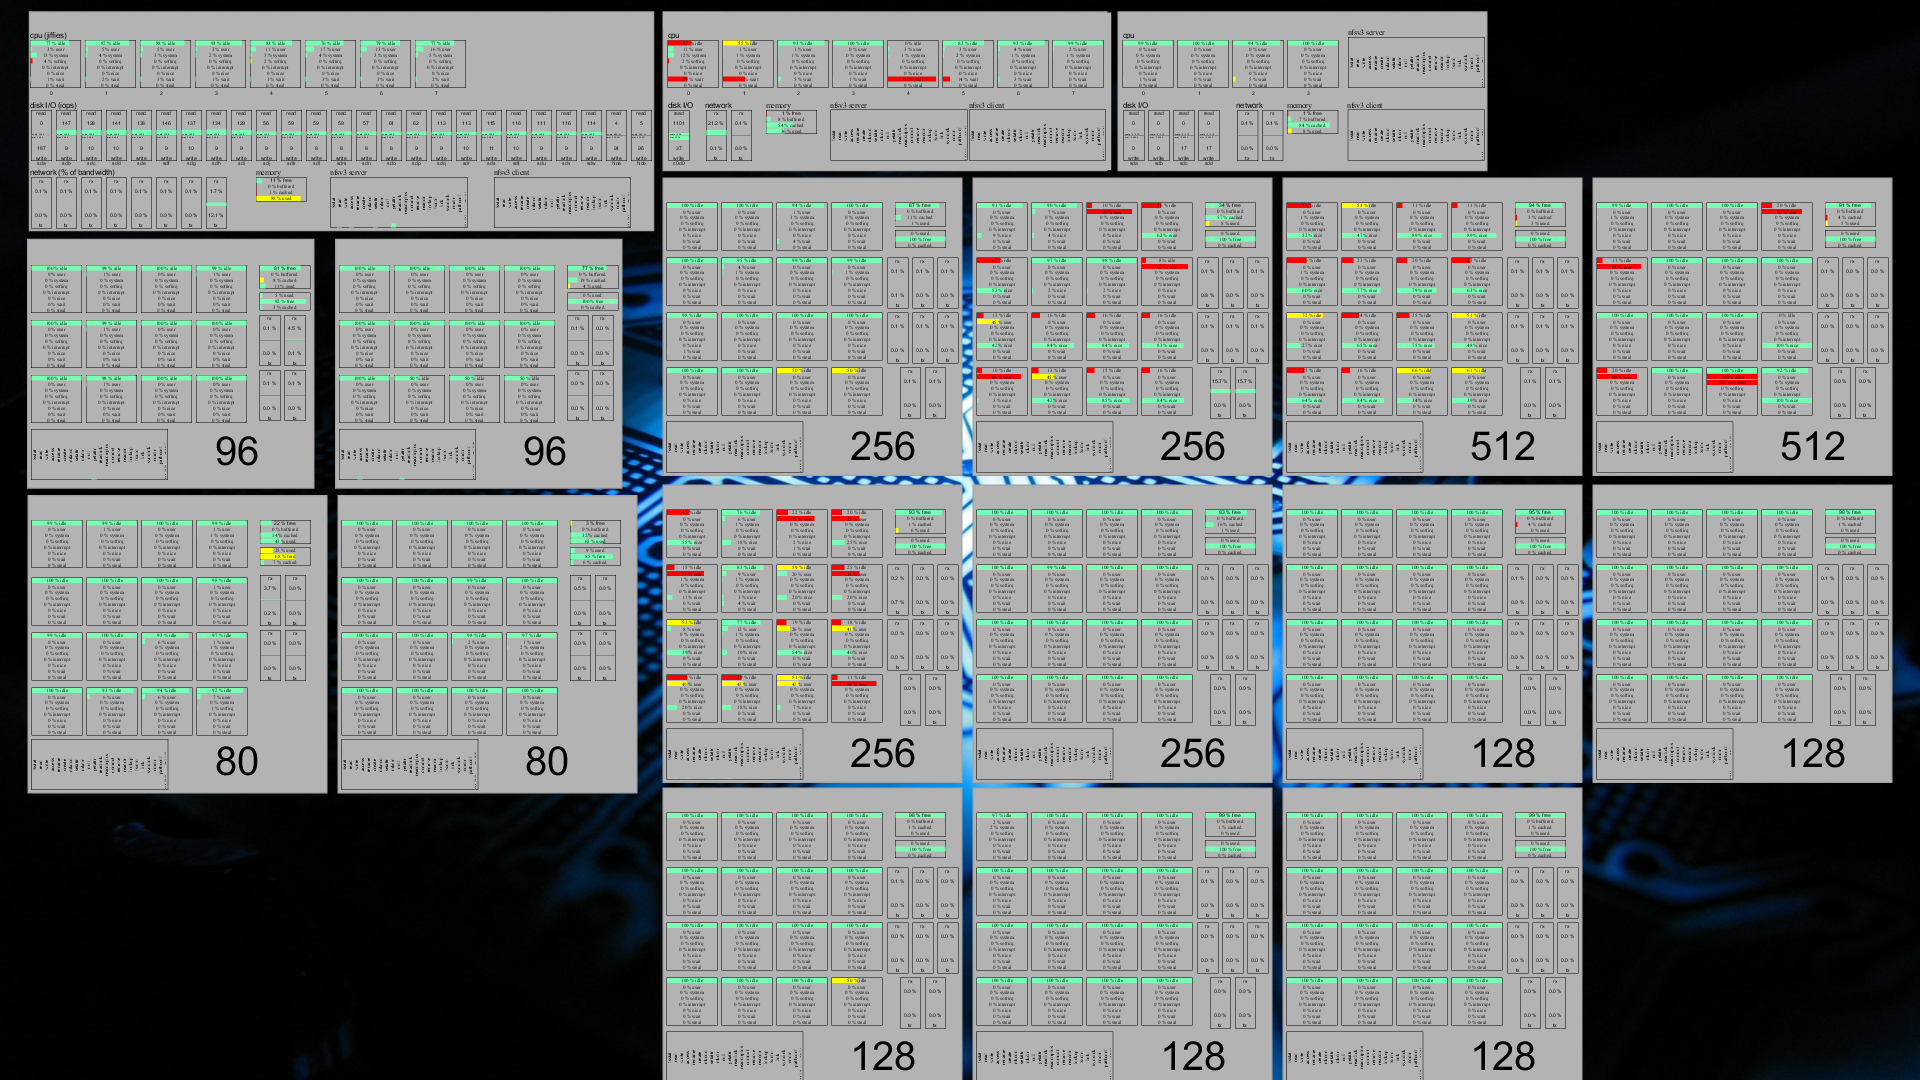
Let's start with a screenshot of the ExtreMon console at the customer
for which I spent time trying to figure out how to get it up and
running:

Click for full sized version. You'll note that even in that full-sized
version, many things are unreadable. This is because the ExtreMon
console allows one to move around (right mouse button drag for zoom;
left mouse button drag for moving around; control+RMB for rotate; center
mouse button to reset to default); so what matters is that everything
fits on the screen, not whether it is all readable (if you need to read,
you zoom).
The image shows 18 rectangles. Each rectangle represents a single
machine in this particular customer's HPC cluster. The top three
rectangles are the cluster's file servers; the rest are its high
performance nodes.
You'll note that the left fileserver has 8 processor cores (top row), 8
network cards (bottom row, left part), and it also shows information on
its memory usage (bottom row, small rectangle in the middle) as well as
its NFS client and server procedure calls (bottom row, slightly larger
rectangles to the right). This file server is the one on which I
installed ZFS
a while
back; hence the
large amount of disks visible in the middle row. The leftmost disk is
the root filesystem (which is an ext4 off a hardware RAID1); the two
rightmost "disks" are the PCIe-attached SSDs which are used for the ZFS
L2ARC and write log. The other disks in this file server nicely show how
ZFS does write load balancing over all its disks.
The second file server has a hardware RAID1 on which it stores all its
data; as such, there is only one disk graph there. It is also somewhat
more limited in network, as it has only two NICs. It does, however, also
have 8 cores.
The last file server has no more than four processor cores; in addition,
it also does not have a hardware RAID controller, so it must use
software RAID over its four hard disks. This server is used for archival
purposes, mostly, since it is insufficient for most anything else.
As said, the other nodes are the "compute nodes", where the hard work is
done. Most of these compute nodes have 16 cores each; two have 12
instead. When this particular screenshot was taken, four of the nodes
(the ones showing red in their processor graphs) were hard at work; the
others seem to have been mostly idling. In addition to the familiar
memory, NFS (client only), network, and processor graphs, these nodes
also show a "swap space" graph (just below the memory one), which seems
fine for most nodes, except for the bottom left one (which shows a few
bars that are coloured yellow rather than green).
The green/yellow/red stuff is supposed to represent the "ok", "warning",
"bad" states that would be familiar from Nagios. In this particular
case, however, where "processor is busy all the time" is actually a
wanted state, a low amount of idleness on the part of the processor
isn't actually a problem, on the contrary. I did consider, therefore, to
modify the ExtreMon configuration so that the processor graphs would
not show red when the system was under high load; however, I found
that differences in colour like this actually makes it more easy to see,
at a glance, which machines are busy -- and that's one of the main
reasons why we wanted to set this up.
If you look carefully, you can find a particular processor core in the
graph which shows 100% usage for "idle", "system", and "softirq",
at
the same time. Obviously that can't be the case, so there's a bug
somewhere. Frank seems to believe it is a bug in CollectD; I haven't
verified that. At any rate, though, this isn't usually a problem, due to
the high update frequency of ExtreMon.
The amount of data that's flowing through ExtreMon is amazing:
- 22 values for NFS (times two for the file servers) per server:
22x2x3+22x15
- 4 values for memory: 4x18
- 3 values for swap: 3x15
- 8 values per CPU core: 8x8x2+8x4+8x12x2+8x16x13
- 2 values per disk: 2x25+2+2x4
- 2 values per NIC: 2x8x12+2x2x2+2x4x4
Which renders a grand total of 2887 data points that are shown in this
particular screenshot; and then I'm not even counting all the
intermediate values, some of which also pass through ExtreMon. Nor am I
counting the extra bits which have since been added (this screenshot is
a few days old, now, and I'm still finetuning things). Yet even so,
ExtreMon manages to update those values once every few seconds,
in the
worst case. As a result, the display isn't static for a moment,
constantly moving and updating data so that what you see is never out of
date for more than a second or two.
Awesome.
 Click for full sized version. You'll note that even in that full-sized
version, many things are unreadable. This is because the ExtreMon
console allows one to move around (right mouse button drag for zoom;
left mouse button drag for moving around; control+RMB for rotate; center
mouse button to reset to default); so what matters is that everything
fits on the screen, not whether it is all readable (if you need to read,
you zoom).
The image shows 18 rectangles. Each rectangle represents a single
machine in this particular customer's HPC cluster. The top three
rectangles are the cluster's file servers; the rest are its high
performance nodes.
You'll note that the left fileserver has 8 processor cores (top row), 8
network cards (bottom row, left part), and it also shows information on
its memory usage (bottom row, small rectangle in the middle) as well as
its NFS client and server procedure calls (bottom row, slightly larger
rectangles to the right). This file server is the one on which I
installed ZFS a while
back; hence the
large amount of disks visible in the middle row. The leftmost disk is
the root filesystem (which is an ext4 off a hardware RAID1); the two
rightmost "disks" are the PCIe-attached SSDs which are used for the ZFS
L2ARC and write log. The other disks in this file server nicely show how
ZFS does write load balancing over all its disks.
The second file server has a hardware RAID1 on which it stores all its
data; as such, there is only one disk graph there. It is also somewhat
more limited in network, as it has only two NICs. It does, however, also
have 8 cores.
The last file server has no more than four processor cores; in addition,
it also does not have a hardware RAID controller, so it must use
software RAID over its four hard disks. This server is used for archival
purposes, mostly, since it is insufficient for most anything else.
As said, the other nodes are the "compute nodes", where the hard work is
done. Most of these compute nodes have 16 cores each; two have 12
instead. When this particular screenshot was taken, four of the nodes
(the ones showing red in their processor graphs) were hard at work; the
others seem to have been mostly idling. In addition to the familiar
memory, NFS (client only), network, and processor graphs, these nodes
also show a "swap space" graph (just below the memory one), which seems
fine for most nodes, except for the bottom left one (which shows a few
bars that are coloured yellow rather than green).
The green/yellow/red stuff is supposed to represent the "ok", "warning",
"bad" states that would be familiar from Nagios. In this particular
case, however, where "processor is busy all the time" is actually a
wanted state, a low amount of idleness on the part of the processor
isn't actually a problem, on the contrary. I did consider, therefore, to
modify the ExtreMon configuration so that the processor graphs would
not show red when the system was under high load; however, I found
that differences in colour like this actually makes it more easy to see,
at a glance, which machines are busy -- and that's one of the main
reasons why we wanted to set this up.
If you look carefully, you can find a particular processor core in the
graph which shows 100% usage for "idle", "system", and "softirq", at
the same time. Obviously that can't be the case, so there's a bug
somewhere. Frank seems to believe it is a bug in CollectD; I haven't
verified that. At any rate, though, this isn't usually a problem, due to
the high update frequency of ExtreMon.
The amount of data that's flowing through ExtreMon is amazing:
 Every few days, someone publishes a new guide, tutorial, library or framework about web scraping, the practice of extracting information from websites where an API is either not provided or is otherwise incomplete.
However, I find these resources fundamentally deceptive the arduous parts of "real world" scraping simply aren't in the parsing and extraction of data from the target page, the typical focus of these articles.
The difficulties are invariably in "post-processing"; working around incomplete data on the page, handling errors gracefully and retrying in some (but not all) situations, keeping on top of layout/URL/data changes to the target site, not hitting your target site too often, logging into the target site if necessary and rotating credentials and IP addresses, respecting robots.txt, target site being utterly braindead, keeping users meaningfully informed of scraping progress if they are waiting of it, target site adding and removing data resulting in a null-leaning database schema, sane parallelisation in the presence of prioritisation of important requests, difficulties in monitoring a scraping system due to its implicitly non-deterministic nature, and general problems associated with long-running background processes in web stacks.
Et cetera.
In other words, extracting the right text on the page is the easiest and trivial part by far, with little practical difference between an admittedly cute jQuery-esque parsing library or even just using a blunt regular expression.
It would be quixotic to simply retort that sites should provide "proper" APIs but I would love to see more attempts at solutions that go beyond the superficial.
 A new release of the
 I promised to write about this a long time, ooops... :-)
Another ARM port in Debian - yay!
arm64 is officially a release architecture for Jessie, aka Debian
version 8. That's taken a lot of manual porting and development effort
over the last couple of years, and it's also taken a lot of CPU time -
there are ~21,000 source packages in Debian Jessie! As is often the
case for a brand new architecture like arm64 (or AArch64, to use ARM's
own terminology), hardware can be really difficult to get hold of. In
time this will cease to be an issue as hardware becomes more
commoditised, but in Debian we really struggled to get hold of
equipment for a very long time during the early part of the port.
First bring-up in Debian Ports
To start with, we could use ARM's own AArch64 software models to
build the first few packages. This worked, but only very slowly. Then
Chen Baozi and the folks running
the
 My LTS December
In December 2014 I spent 11h on Debian LTS work and managed to get six DLAs released and another one almost done... I did:


 This was my first month working on Debian LTS. My first project
at

 My monthly report covers a large part of what I have been doing in the free software world. I write it for
 If you re a Unix person instead of e.g. a Microsoft Windows person, you ve probably been annoyed by Iceweasel (or Mozilla Firefox ) creating a ~/Desktop directory, among others (things like ~/Downloads).
Here s a quick fix I found somewhere in the net:
 Happy New Year everyone! How did you celebrate the year change? I've been at the
 To work with GnuPG and smartcards you install GnuPG agent, scdaemon, pscsd and pcsc-tools. On Debian you can do it like this:
 Having seen the end of December and the beginning of January, this is the time of year where we say "Happy new year!"
But this is a very interesting new year: We have also went past our much announced deadline for the <2048 bit keys to be removed from the Debian keyrings. And yes, our highly efficient keyring-maint team managed to deliver on the promised time And, I'd say, with much success. Lets see the numbers Only before that, refer to


