Dirk Eddelbuettel: More on 'nicer charts'
Via the Planet Debian aggregator and
his blog, Sven
followed
up on my post
regarding
Lucas' plot of the package age distribution.
As some of my points didn't seem to make it across, I will reiterate them
more plainly:
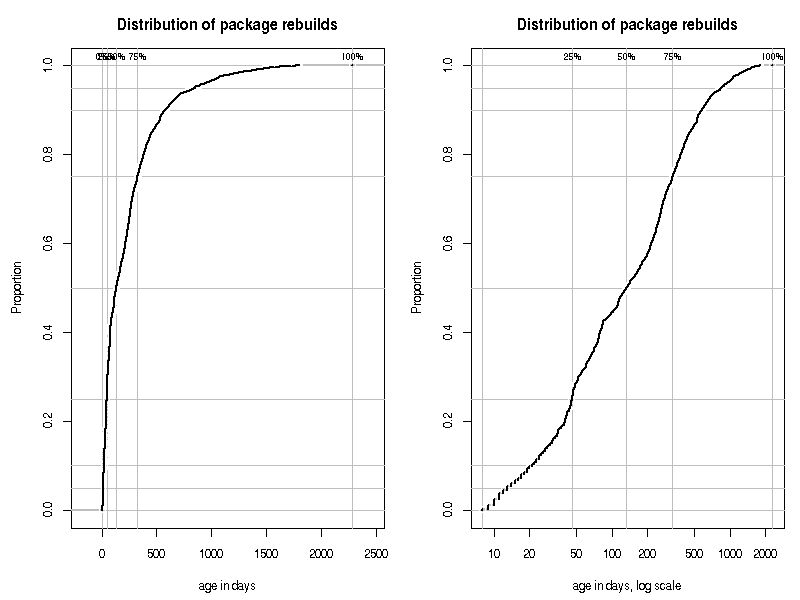 While it is close to impossible to find the 25 or 50 percentile on the first
chart, it becomes a lot easier on the second chart because the x-axis is
'stretched' using the log transform. About one quarters of the distribution appears
to be rebuild within 1.5 months old, and about half is younger than four
months (as a quick call to
- GNUplot, while easy to use, creates charts that aren't terribly pretty;
- Lucas' original chart had, to paraphrase an expression by Tufte, a poor 'ink to paper ratio': the data is too concentrated in the last quartile;
- for that very reason, taking logs is a good thing here
ecdf
and plot.stepfun (rather than
redoing it ad-hoc as I had done), and also add explicitly quantiles. The two
charts use the exact same instructions; however the second chart transforms
the x-axis to a logarithmic scale.
While it is close to impossible to find the 25 or 50 percentile on the first
chart, it becomes a lot easier on the second chart because the x-axis is
'stretched' using the log transform. About one quarters of the distribution appears
to be rebuild within 1.5 months old, and about half is younger than four
months (as a quick call to summary(pkgAge) confirms). Reading
these proprtions off the original chart, or the non-log chart, is much more difficult.
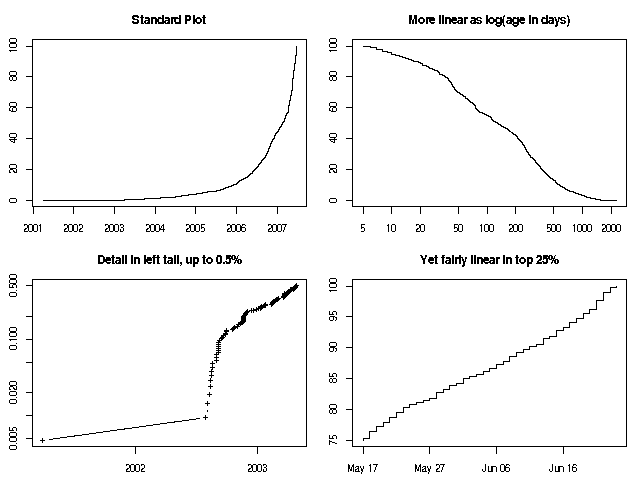 Updated to correctly display the assignment operator
 Most packages are actually quite recent. 9008 packages (43%) were built after the release of etch. And 19857 packages (94%) were built after the release of sarge. But that still leaves us with 1265 packages that were built before sarge was released, and even one package (
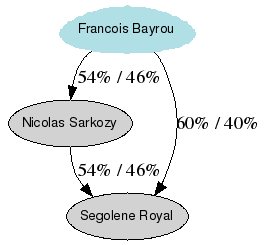 So Francois Bayrou is the Condorcet winner, and should win the election. However, the first round results, according to the same poll, could be: