
Outlier detection (also: anomaly detection, change detection) is an
unsupervised data mining task that tries to identify the unexpected.
Most outlier detection methods are based on some notion of density:
in an appropriate data representation, "normal" data is expected to cluster,
and outliers are expected to be further away from the normal data.
This intuition can be quantified in different ways. Common heuristics
include kNN outlier detection and the
Local Outlier Factor
(which uses a density quotient). One of the directions in my dissertation was to
understand (also from a statistical point of view) how the output and the formal
structure of these methods can be best understood.
I will present two smaller results of this analysis at the
SIAM Data Mining 2014
conference: instead of the very heuristic density estimation found in above methods,
we design a method (using the same generalized pattern) that uses a best-practise
from statistics:
Kernel
Density Estimation. We aren't the first to attempt this (c.f. LDF), but we
actuall retain the properties of the kernel, whereas the authors of LDF tried
to mimic the LOF method too closely, and this way damaged the kernel.
The other result presented in this work is the need to customize.
When working with real data, using "library algorithms" will more often than not
fail. The reason is that real data isn't as nicely behaved - it's dirty, it seldom
is normal distributed. And the problem that we're trying to solve is often much
narrower. For best results, we need to integrate our preexisting knowledge
of the data into the algorithm. Sometimes we can do so by preprocessing and
feature transformation. But sometimes, we can also customize the algorithm easily.
Outlier detection algorithms aren't black magic, or carefully adjusted. They follow
a rather simple logic, and this means that we can easily take only parts of these methods,
and adjust them as necessary for our problem at hand!
The article persented at SDM will demonstrate such a use case: analyzing 1.2 million
traffic accidents in the UK (from
data.gov.uk) we are
not interested in "classic" density based outliers - this would be a rare traffic accident
on a small road somewhere in Scotland. Instead, we're interested in
unusual
concentrations of traffic accidents, i.e. blackspots.
The generalized pattern can be easily customized for this task. While this data does
not allow automatic evaluation, many outliers could be easily verified using Google Earth
and search: often, historic imagery on Google Earth showed that the road layout was changed,
or that there are many news reports about the dangerous road. The data can also be nicely
visualized, and I'd like to share these examples with you. First, here is a screenshot
from Google Earth for one of the hotspots (Cherry Lane Roundabout, North of Heathrow airport, which
used to be a double cut-through roundabout - one of the cut-throughs was removed since):

Google Earth is best for exploring this result, because you can hide and
show the density overlay to see the crossroad below; and you can go back in
time to access historic imagery. Unfortunately, KML does not allow easy interactions (at least it didn't last time I checked).
I have also put the
KML
file on Google Drive. It will automatically display it on Google Maps (nice
feature of Drive, kudos to Google!), but it should also allow you to download
it. I've also explored the data on an Android tablet (but I don't think you can
hide elements there, or access historic imagery as in the desktop
application).
With a classic outlier detection method, this analysis would not have been possible.
However, it was easy to customize the method; and the results are actually more meaningful: instead
of relying on some heuristic to choose kernel bandwidth, I opted for choosing the bandwidth by
physical arguments: 50 meters is a reasonable bandwidth for a crossroad / roundabout, and for
comparison a radius of 2 kilometers is used to model the typical accident density in this region (there
should other crossroads within 2 km in Europe).
Since I advocate reproducible science, the source code of the basic
method will be in the next
ELKI
release. For the customization case studies, I plan to share them as a how-to
or tutorial type of document in the ELKI wiki; probably also detailing
data preprocessing and visualization aspects. The code for the customizations
is not really suited for direct inclusion in the ELKI framework, but can serve
as an example for advanced usage.
Reference:
E. Schubert, A. Zimek, H.-P. Kriegel
Generalized Outlier Detection with Flexible Kernel Density Estimates
In Proceedings of the 14th SIAM International Conference on Data Mining (SDM), Philadelphia, PA, 2014.
So TLDR of the story: A) try to use more established statistics (such as
KDE), and B) don't expect an off-the-shelf solution to do magic, but customize
the method for your problem.
P.S. if you happen to know nice post-doc positions in academia:
I'm actively looking for a position to continue my research. I'm working on
scaling these methods to larger data and to make them work with various
real data that I can find. Open-source, modular and efficient
implementations are very important to me, and one of the directions I'd like
to investigate is porting these methods to a distributed setting, for
example using Spark. In order to get closer to "real" data, I've started to
make these approaches work e.g. on textual data, mixed type data, multimedia
etc. And of course, I like teaching; which is why I would prefer a position in
academia.
 It's taken a while to get here, but the code of conduct that I set out
to produce about a year ago now has been voted on. The result which has
been
released
earlier this week is that the code of conduct has been accepted, but
that future updates would require another GR.
Although not my personal preference, it's pretty much what I expected. I
still think allowing the DPL to update the code of conduct in the future
would be preferable over having to go through another GR (after all, if
the DPL does something silly, we have ways of reverting that decision);
but regardless, the fact that the code of conduct is accepted is, in my
opinion, a major step forward for Debian.
Thanks to everyone who voted!
 I have heard many good things about

 The IT security world is still reeling from the impact of the
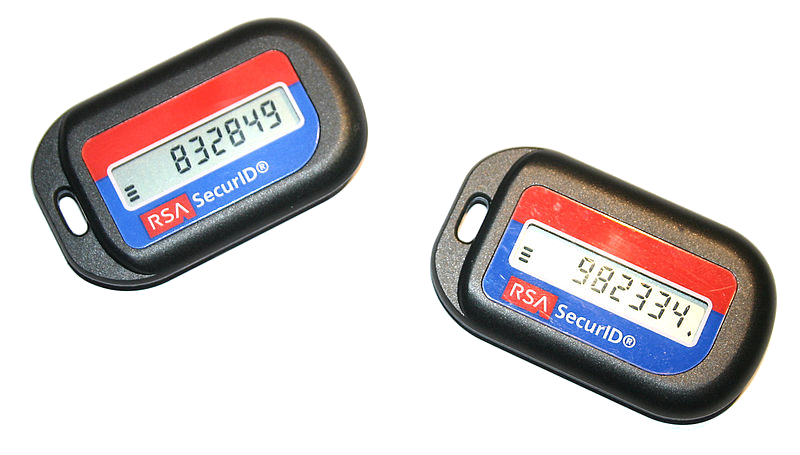 Unfortunately, SMS is no substitute to the one-time-passwords generated using
 The insecurity of traditional telephone networks has been on display for all the world to see in the
 The staggering reality of the situation is that attackers don't even have to directly hack their victim's phones to access SMS messages.
As the Android API documentation demonstrates,
 Next time you log in to a web site, if the firm does try to enrol you in an SMS authentication scheme, it may be a good idea to click the "No thanks" option.
If you have already been registered into an SMS authentication scheme, fill out the online complaint form and inform the firm that you will only accept a proper authentication token or
 My alternative option to
 Distributing software efficiently accross your platform can be
difficult. Every distribution comes with a package manager which is
usually suited for this task.

 Current Glamor Performance
I finally managed to get a



 After quite a few hours of work, I finally switched completely to DNSSEC. Both client-side in my notebook, and in my personal tincho.org domain.
The client-side was pretty easy, although something broke in
 On the last UDS we talked about
 Update: As the comments pointed out, this bricked








 I picked up a Panasonic BDT-230 a couple of months ago. Then I discovered that even though it appeared fairly straightforward to make it DVD region free (I have a large pile of PAL region 2 DVDs), the US models refuse to play back PAL content. We live in an era of software-defined functionality. While Panasonic could have designed a separate hardware SKU with a hard block on PAL output, that would seem like unnecessary expense. So, playing with the firmware seemed like a reasonable start.







 Debian 7.5 will include an update to the Linux kernel, based on
Linux 3.2.57. Package version 3.2.57-2 is currently available in
the wheezy-proposed-updates suite. I would appreciate any testing
people can do to find regressions in the next few days.
In addition to bug fixes, this version updates the e1000e and igb
drivers. The drivers are now based on the versions found in Linux
3.13, which support several newer chips (i210, i211, i217, i218,
i354). Please consider testing this new kernel if you have an Intel
gigabit Ethernet controller, even if it was already supported in
Linux 3.2.
 I gave a talk this year at