Ulrich Dangel: Analyzing rc bug messages
Michael Stapelberg recently posted a blog post about looking into the number of Debian Developers actively working on RC bugs for the upcoming wheezy release.
In this blog post I analyze the data shared by Michael and provide the Analysis
After parsing the data file we typically want to get an understanding of the data, by using
R commands used to generate the plots & findings. If you are interested into looking into the data yourself, but don t like R, I suggest using ipython notebook + numpy instead.
Analysis
After parsing the data file we typically want to get an understanding of the data, by using summary(bugs) we get the minimum(1), median(5), mean(15.4), max(716) and quantiles of the data. This shows that the number of messages is wide-spread and a few people contribute a lot. To visualize the dispersion of the data we can create a box plot showing the range of messages:
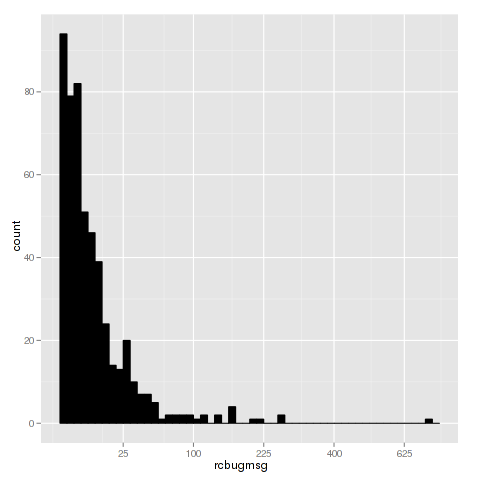
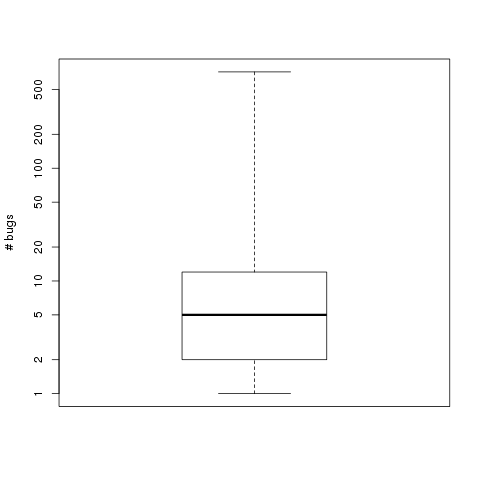 As the first and third quantile are close together we can assume that the majority of the work is done by a few, especially since the second quantile is 5. This is supported by the histogram below, where the x axis is the number of recorded messages and y is the number of developers.
Top 10 contributors
The TOP 10 contributors, according to the dataset, are:
- Lucas Nussbaum - 716 messages
- Gregor Herrmann - 270 messages
- Jakub Wilk - 270 messages
- Andreas Beckmann - 225 messages
- Julien Cristau - 205 messages
- Cyril Brulebois - 169 messages
- Moritz Muehlenhoff - 162 messages
- Michael Biebl - 159 messages
- Salvatore Bonaccorso - 158 messages
- Christoph Egger - 142 messages
r commands
These are the commands used to generate the plots and information in this plot:
bugs <- read.csv("by-msg.csv")
summary(bugs)
boxplot(bugs$rcbugmsg, log='y', range=0, ylab="# bugs")
quantile(bugs$rcbugmsg)
0%  25%  50%  75% 100%
1    2    5   12  716
# create histogram
llibrary('ggplot2')
ggplot(bugs, aes(x=rcbugmsg)) + geom_histogram(binwidth=.5, colour="black", fill="black") + scale_x_sqrt()
top10 <- tail(bugs[order(bugs$rcbugmsg),], 10)
top10
- Lucas Nussbaum - 716 messages
- Gregor Herrmann - 270 messages
- Jakub Wilk - 270 messages
- Andreas Beckmann - 225 messages
- Julien Cristau - 205 messages
- Cyril Brulebois - 169 messages
- Moritz Muehlenhoff - 162 messages
- Michael Biebl - 159 messages
- Salvatore Bonaccorso - 158 messages
- Christoph Egger - 142 messages
r commands
These are the commands used to generate the plots and information in this plot:
bugs <- read.csv("by-msg.csv")
summary(bugs)
boxplot(bugs$rcbugmsg, log='y', range=0, ylab="# bugs")
quantile(bugs$rcbugmsg)
0%  25%  50%  75% 100%
1    2    5   12  716
# create histogram
llibrary('ggplot2')
ggplot(bugs, aes(x=rcbugmsg)) + geom_histogram(binwidth=.5, colour="black", fill="black") + scale_x_sqrt()
top10 <- tail(bugs[order(bugs$rcbugmsg),], 10)
top10
bugs <- read.csv("by-msg.csv")
summary(bugs)
boxplot(bugs$rcbugmsg, log='y', range=0, ylab="# bugs")
quantile(bugs$rcbugmsg)
0% 25% 50% 75% 100%
1 2 5 12 716
# create histogram
llibrary('ggplot2')
ggplot(bugs, aes(x=rcbugmsg)) + geom_histogram(binwidth=.5, colour="black", fill="black") + scale_x_sqrt()
top10 <- tail(bugs[order(bugs$rcbugmsg),], 10)
top10


 A new
 Hello, World,
As many of you know, I fell into helping get the artwork for Wheezy into place. While I don t want to do this (in the long run), I feel the urge to get it into shape for Jessie.
I d like to do a small request for methods to improve the theme packaging. I ve posted a

 (actually, please set your calendars to the day before yesterday I had a mental tab on this, but it seems watching mental tabs is a low-priority task for brain.sched)
Ten years ago today, I got that long awaited mail telling me I had passed all of the needed hurdles and was accepted as a Debian Developer. We were at the first third of a very long release cycle, and the general spirit of the project was clearly younger both as in "things moved easier" and "we were much more immature" Try to follow the mailing list discussions we had back then, and even with all the vitriol that's every now and then spilled on
 If traveling in Switzerland to see the mountains, then it works out cheaper to fly into Milan, Italy, which is very close to the Swiss border. Most of the journey from Milan to Vaumarcus can be covered using one of the Swiss railway travel passes, with stops for sight-seeing on the way, and the other days on the pass used for sight-seeing.
Now imagine people arriving in a group: the rail ticket prices quickly add up. For a family of four, 4 * 315 = CHF 1,260. Car rental may be a better option. Hiring a car in Switzerland is expensive, hiring in Italy is much cheaper, the plane tickets to Italy are cheaper too, so there is a lot of money to be saved.
 But who wants the hassle of travelling to Switzerland via Italy?
Of course that is the silliest rhetorical question you are going to see this week: visiting Italy is not a hassle at all. Even the Swiss enjoy going there so much that they just built the world's longest rail tunnel under the Alps to bring Como and Milan that little bit closer, the


 The first leg was skipped because of the low cloud cover. Weather reports in Switzerland, such as

 I know it's been ages since I last blogged anything at all. To some degree I had a down phase, but I hope to get out of it. It's nice to see that there are people out there who give me a prod every now and then, and don't let me drown. Thanks, most of you probably know that I mean exactly you, and in case you are uncertain, you probably are meant if you contact me every now and then.
Anyway, if you remember that I blogged about
