Search Results: "Dirk Eddelbuettel"

22 October 2007

Dirk Eddelbuettel: Frank Lloyd Wright Race 2007

Today was the 31th annual Frank Lloyd Wright Race in Oak Park, next door to where I live. This is a really nice small race I've run in 2006, 2004 and 2003. Conditions today were almost ideal -- we're having unseasonally warm weather, and it was sunny and in the high 60s without any noticeable winds around the start time making it feel like a nice late summer morning, rather than the middle of fall. I wasn't aiming for something really fast as I am still in training for a longer race and had done some reasonably fast one-mile laps yesterday morning leaving me not exactly well rested. But for once, I actually managed to run a steady pace, and then ended up within seconds of last year's PR for the distance at 41:15 for a pace of around 6:39, so I'm quite pleased.

16 October 2007

Dirk Eddelbuettel: Some marathon data analysis

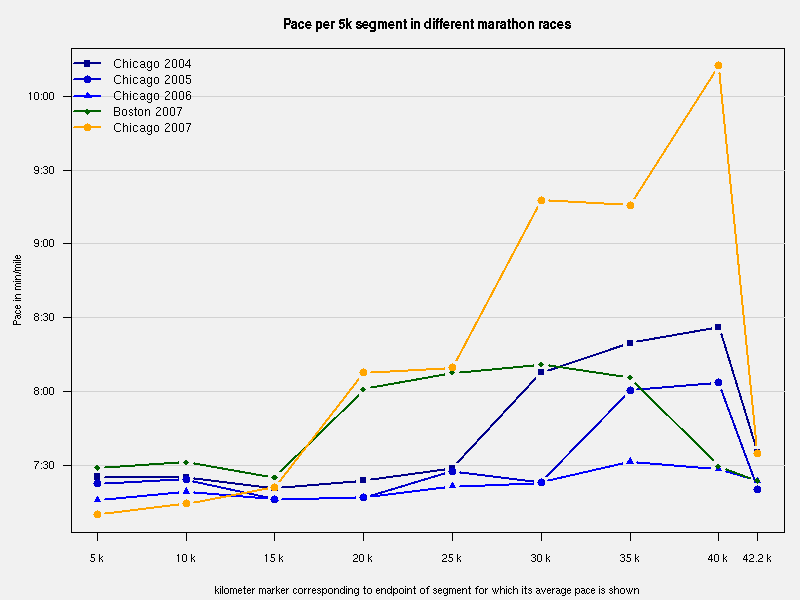
A few days after the Chicago Marathon in record-heat, I was wondering just how much more I had been slowing down, and exactly when during the course of the race this occurred. Bigger races like Chicago provide the so-called 'splits' for every five kilometer segment. Helpfully, they also keep these with the archived results which are all accessible via the web. So it was easy enough to collect a sequence of time such as '0:22:34', '0:45:30', ... and so on. And thanks to R, my data slicing and dicing and visualizing tool of choice, it was just a handful of lines to produce the chart below. The chart covers my four Chicago marathons (2004, 2005, 2006 and 2007) as well as Boston (2007) --- the infamous '27.2 mile marathon' seems to have dropped off the net, and the smaller Sunburst does not have 5k split times. (pace comparison chart) The chart shows a few things quite nicely: While it was a tough race, I clearly ran a lot slower than previously, in particular between 25 km and 40 km. So there.

14 October 2007

Dirk Eddelbuettel: Tunes

Following Adam's suggestion about Pandora, I spent a the rest of the afternoon, evening and this morning listening to music old and new. Pandora's suggestions around Madeleine Peyroux were particularly nice as they lead for example to Sam Philipps which was new to me. I can already see this leading to increased spending on new cds... Recommended.

13 October 2007

Dirk Eddelbuettel: Makin' Tracks 2007

This morning was the annual Makin' Tracks 5k. As this starts three blocks from my house, supports the track at Concordia, a small college up the street from me, and runs right through my immediate neighbourhood, it's hard not to participate. This year was of course not even a week after the somewhat eventful Chicago Marathon in record-heat so I wasn't sure how well I'd do. Once again, I started way too fast and ran two miles at a 6:00 min/mile pace that I couldn't sustain just a week after a (arguably slow but still full distance) marathon, so I slowed down and finished at 19:41.7 or so for a pace of 6:23, or about eight seconds slower than my best time from last year (when we ran before the marathon). Onto the Frank Lloyd Wright 5k/10k next week, then!

10 October 2007

Dirk Eddelbuettel: Chicago Marathon 2007

Last Sunday, the 30th Chicago Marathon took place. This was meant to be the year to make this marathon even bigger: the field had increased substantially to 45,000 registrations yet it still sold out way earlier than in previous years. As it turns out, the weather did have its own surprises in store. Earlier in the preceding week, the forecast changed from overcast and rainy to sunny. And sunny it was. While we had a bit of cloud cover at the start at 8:00am, temperatures were already in the 70s and keep increasing. This year's marathon is now on the books as the hottest ever: the clouds dissipated and it was a scorcher. Needless to say, it was a rather challenging race. I finished in 3:41:39, which is my slowest time by some margin for the by now seven marathons I've ran. It was not the day for running fast. Of course, I didn't quite grok that at the start and ran ten miles reasonably hard in a quick pace, but then paid for it, and then paid some more. That said, apparently around 10,000 registered entrants didn't even start, and another 10,000 did not make it to the finish. With the heat, several hundred were treated by the medical teams. Worse still, one 35-year old runner from Michigan died (though the autopsy claims he had a heart condition; other reports say that alone cannot have been lethal). The race itself was aborted, and those who had not reached the half-way point by 12:00am were diverted to the finish and urged to walk rather than run. According to the (by now fairly extensive) news coverage, this whole experience left quite a few people mad and bewildered. As of today, a good 48 hours after the race, the City seems to be in some sort of crisis management mode to prevent damage for the oh-so-important bid for the 2016 Olympics. For some flavour of the news coverage, see an early report, some stunning pictures and some suggestions to prevent another one like this, all from the Chicagoist blog.

4 October 2007

Dirk Eddelbuettel: Beancounter minor bug fix release 0.8.8

For some odd reason, the trusted Perl module Date::Manip now wants the "approx" argument to format date differences. Adding this in the five calls across beancounter and BeanCounter.pm is the main change in version 0.8.8 which is now in Debian's incoming area, uploaded to CPAN and onto the beancounter page here.

27 September 2007

Dirk Eddelbuettel: Dear Samsung,

Your ML-3051N is a lovely little 'network printer. Hopefully, it will serve us well in the next few years as a replacement for the thirteen year old HP Laserjet ML we bought (for about five times the price: a native postscript printer was rather expensive in 1994) a long time ago. And you even mention that it can talk to Linux! But still, I have a few things to talk to you about:
  1. as you mention Linux, it's a tad odd that you enumerate various flavours (RH 8 to 9; FC 1 to 3; Mandrake 9 to 10.2; SuSE 8.2 to 9.2) but happen to exclude the two variants that run around here: Debian and its cousin Ubuntu. Besides, the versions of those other flavours are a tad old, no?
  2. as you ship Linux software on a cdrom, it is even odder that the install shell script fails (note: spaces between #! and /bin/sh may not be a good idea). Fails not once, but twice: you say /bin/sh, but you meant /bin/bash as you use features of the latter. Oh well, I guess we all made that mistake in our youth. Irregardless, the software never installed. Which is a pity as this would be about the first 'household appliance' I bought with native Linux support. So close, and yet so far.
  3. the control panel is a cumbersome way to set a static IP and to turn the odd protocol off.
  4. did I really have to install all this windoze stuff on my wife's laptop just to learn that the printer does in fact have a nice web interface? You could have mentioned that with Linux info, no? It is in fact a rather nice and complete web interface.
  5. as you supply networking support, do you really have to enable every possible protocol under the sun? I mean slp, snmp, multicast dns, dynamic dns, raw tcp, ipp, ethertalk, netware ...? I still see my cable modem go down 'seemingly randomly' rigth after I print even though I now disabled just about everything but raw tcp to port 9100 as well as ipp to 613. Still, dropping the cable connection just because the printer wakes up is odd, isn't it?
  6. Cups, foomatic and all the other printing goodies do not yet know the ML-3050 family, so we are making do with the ML-2151NPS settings for postscript. Works fine, so I won't bother copying the ppd file from the cdrom to the handful of computers around here.
Kind regards, Dirk Updated to fix a markup error. And the shebanh space is standard, I am told.

11 September 2007

Dirk Eddelbuettel: Overdue smtm bug fix releases 1.6.9

Some time ago, Yahoo! Finance made some changes at their backend for the provisioning of png images which are also displayed by smtm. Version 1.6.9, which just went to Debian's master site and will go to CPAN in a moment, finally updates the code for that. My apologies for taking so long, and thanks to Michael Kurlin, Clinton R Lambe, Ian Seow and possibly others whose mail I haven't kept who sent me patches and heads-ups.

Dirk Eddelbuettel: Another option for MythTV schedules

Yesterday I mentioned how straightforward it was to setup an account with SchedulesDirect to obtain tv schedule data for the MythTV 'software pvr'. For completeness, a 'free as in beer' screen-scraping alternative is provided by the zap2xml Perl script together with a (free) registration at the tvlistings.zap2it.com site. Instructions are on the zap2xml page, and all is left to do is to combine the calls to zap2xml.pl and mythfilldatabase in a single shell script -- which is easy enough to do too.

10 September 2007

Dirk Eddelbuettel: MythTV data service switch

One of several things I never got around to blog about is my experience with MythTV (which, in case you don't know, turns your pc into a tivo, given a suitable tv decoder card and the mythtv software). To make up for the lack of a more detailed post, let's just recap: I had set it up a little over two years ago, on what was then a 'possibly temporary' Kubuntu box. Well the box is still there and still running Kubuntu, four releases later, and MythTV only got easier as Ubuntu now includes the decoder drivers. So far no worries. TV schedule information had always been provided via the 'free as in beer if you answer a question or two' zap2it subsidiary of the for-profit Tribune publishing company (i.e. the folks who own the Chicago Tribune, Cubs baseball team, WGN TV station around here and what have you, and are in the process of being sold to Sam Zeil). As had been noted in other places, that 'free' service is no more, and a seemingly cooperatively-run 'small fee' service has been set up by a few volunteers at schedulesdirect. So I just switched, and for the benefit of anybody sitting on the fence about this, the switch is trivial:
  1. If need be, add 'feisty-proposed' to apt's sources.list file to get the new MythTV 0.20.2 release directly from Ubuntu.
  2. Install MythTV 0.20.2 which takes as little as wajig update; wajig dist-upgrade
  3. Follow the instructions in this email, in particular point 4) about re-creating lineup info
  4. sit back and enjoy
Including the signup at schedulesdirect, the whole thing took maybe ten minutes. Not bad. Now I only have to find some spare time so that the backlog of unwatched episodes of the Daily Show does not grow much beyond six months... Oh, and last but not least, I'll have to pony up the fifteen bucks for the subscription once my trial is up next Sunday.

Dirk Eddelbuettel: Chicago Half Marathon 2007

This morning was this year's Chicago Half Marathon, the race I often refer to as 'my favourite' after having participated in 2006, 2005, 2004 and 2003. But this year I somehow managed to convince myself I had already registered, when I had not. Doh. But due to a friend's unlucky injury, I could re-use his registration and still race. Weather was once again gorgeous, but maybe a little on the hot side. I tried not to push myself too hard given the two big races coming up in the next seven weeks and ran a decent 7:12 min/mile pace for a chip time of 1:34:20.

3 September 2007

Dirk Eddelbuettel: Another Herbie Hancock concert

Herbie Hancock was in town to open this year's Chicago Jazz Festival with a concert at the CSO last Thursday. This time he came with a mostly-electric setup featuring Nathan East on bass, Vinnie Colaiuta on drums and Lionel Loueke on guitar. I found it at times a little heavy on the synthesizers, but it was evident that Hancock and the band enjoyed themselves during the two hour set. A nice concert, all in all, and again very different from his last two concerts.

12 August 2007

Dirk Eddelbuettel: The amazing Prof. Ripley (cont'ed)

A little mini-meme got started on August 1 when Ben Bolker posted the following code to the r-devel list (and here I substituted the more standard '-' assignment operator for the less standard though-now permitted '='):
x <- readLines("http://developer.r-project.org/R.svnlog.2007")
rx <- x[grep("^r",x)]
who <- gsub(" ","",sapply(strsplit(rx,"\\ "),"[",2))
twho <- table(who)
twho["ripley"]/sum(twho)
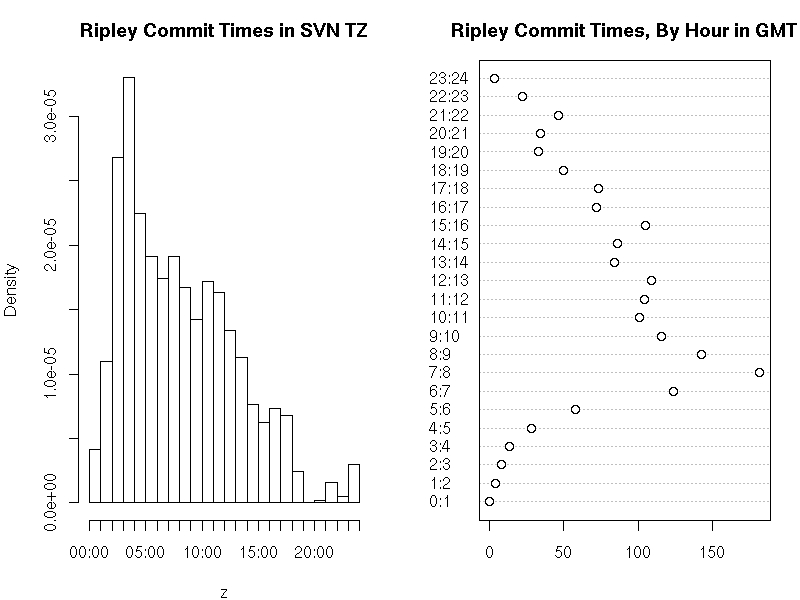
In five lines (that could be shortened to three at the expense of some readibility), the SVN log for R is downloaded directly from the website, the revision authors are extraced and then tabulated by submitter. The relative percentage of Brian Ripley is found to be a staggering 74.8% -- or about three times as much as the other fifteen committers combined. Smokes. [ Oh, and for those who don't know him, he's also got a day job which presumably entails looking after his graduate students at Oxford. Who knows, he may even teach. Kidding aside, he's actually one of the nicest persons you'll ever meet in real life. ] Now yesterday, Simon Jackman who had at first simply repeated Ben's analysis on his own blog followed up with a nice analysis (albeit typeset in a way that rendered the code inoperational, which has now been fixes) that creates both a histogram and a dotplot of commits per hour of the day. Omitting Ben's code which Simon reuses, we have the following for histogram and dotchart:
tod <- unlist(sapply(rx,function(x)strsplit(x,split=" ")[[1]][6]))
tod <- tod[who=="ripley"]
tz <- sub(pattern=".*(-[0-9] 4 ).*",replacement="\\1",x=rx)
tz <- tz[who=="ripley"]
tz <- as.numeric(tz)/100
offset <- 3600*tz
z <- strptime(tod,format="%H:%M:%S")
hist(z,"hours",main="Ripley Commit Times in SVN TZ")
h <- z - offset
h <- format(h,format="%H")
h <- factor(as.numeric(h), levels=0:23)
dotchart(table(h), main="Ripley Commit Times, By Hour in GMT",
         labels=paste(0:23,1:24,sep=":"))
This extracts the commit times, subsets to the ones by Prof. Ripley, extracts the timezones component (as strptime seemingly doesn't do that which is a pain), extracts the tz-less time via strptime into a variable 'z' for which the histogram is drawn. He then corrects the times by the tz offset expressed in seconds, formats is as hour of the day and turns it into a 'factor' (an R data type for qualitative variables which may be ordered as is the case here) and draws a dotplot. This results in the following chart: Simon Jackman's per-hour charts of Brian Ripley's commit patterns Now, nobody has looked at the time series. So we correct this and add the following:
## rather extract both  date and time
dat <- unlist(sapply(rx, function(x)  
  txt <- strsplit(x,split=" ")[[1]]
  paste(txt[5], txt[6])
 ))
## subset on Prof Ripley
dat <- dat[who == "ripley"]
## and convert to POSIXct, correcting by tz as well
datpt <- as.POSIXct(strptime(dat,format="%Y-%m-%d %H:%M:%S")) - offset
## turn into zoo -- we use a constant series of ones as each
## committ is taken as a timestamped event
datzoo <- zoo(1, order.by=datpt)
## and use zoo to aggregate into commits per date
daily <- aggregate(datzoo, as.Date(index(datzoo)), sum)
## now plot as grey bars
plot(daily, col='darkgrey', type='h', lwd=2,
     ylab="Nb of SVN commits, three-week median",
     xlab="R release dates 2.5.0 and 2.5.1 shown in orange",
     main="The amazing Prof. Ripley")
## mark the two R releases of 2007
abline(v=c(as.Date("2007-04-24"),as.Date("2007-06-28")),col='orange',lwd=1.5)
## and do a quick centered rolling median
lines(rollmedian(daily, 21, align="center"), lwd=3)
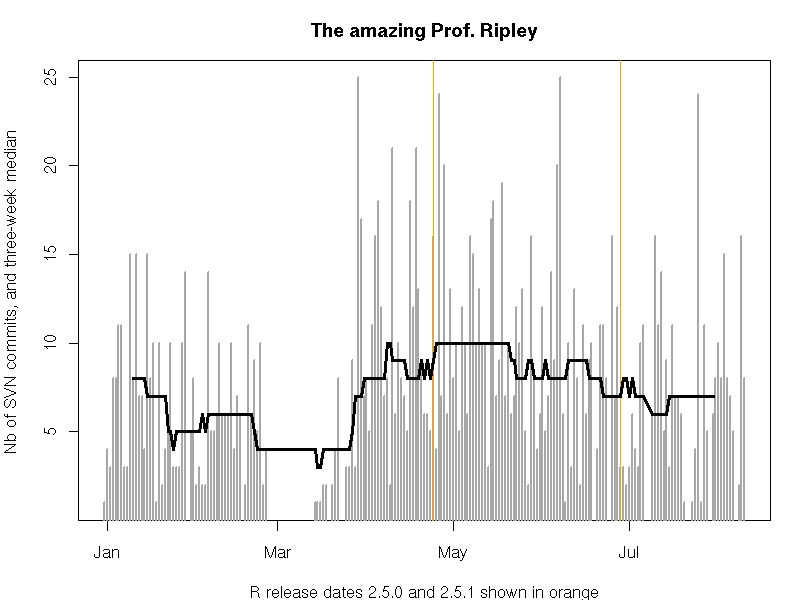
This extracts both date and time, creates a proper R time object (a so-called POSIXct type) from it, fills a zoo ('the' magic class for time series) object with it, uses zoo to aggregate commits per day and plots those in a barchart-alike (I know, I know, ...) plot to which we add the two releases as well as a rolling and centered three-week median (as a real quick hack rather than a proper smooth). Timeseries of Brian Ripley's commit patterns This shows that Prof Ripley averaged about ten commits a day before and after the release of R 2.5.0, and that he has slowed down ever so slightly since then to end up at around a mere seven commits a day. Every day. For the seven-plus months we looked at. So, anyone for analysing his r-help posting frequencies ?

11 August 2007

Dirk Eddelbuettel: UseR! 2007: Two talks and a new R package 'RDieHarder'

The first UseR! conference in North America ended yesterday. I gave two talks and updated my presentations page accordingly. One talk was joint work with Steffen Moeller (who had also presented our work in Italy in June, and I added that presentation too), David Vernazobres and Albrecht Gebhard and concerns automated building of around two thousand (!!) new Debian source packages for all CRAN and BioConductor packages for GNU R. I plan to send something to debian-devel on that in a day or two as well because the time is right for some feedback on this. The other talk was on about RDieHarder. This is joint work with Robert G. Brown and uses his DieHarder library for random number testing (that I've added to Debian a few months back). It allows R to both runs these tests, and to further analyse and visualize the test results. I finally uploaded RDieHarder to CRAN a few days ago -- in fact, my CRANberries rss feed of new CRAN packages had it show up the morning of the presentation. And now that I've added a webpage about RDieHarder I can finally say it's been released.

21 July 2007

Dirk Eddelbuettel: Dead disks, and lvm woes

As posted earlier on the rather recently announced CRANberries feed (that is generated and hosted on my box) covering CRAN package updates, my main server bit the dust. The hard disk no longer wants to talk to any of its lvm partitions, leaving me without /usr, /var/, /var/local/, /home, /srv. Fortunately, most of this was backed-up but now I have to go through reconfiguring the replacement machine I already set up. Not fun. If anybody has tips on recovering the lvm partitions, I'm all ears. /etc/lvm/ seems fine if that helps as a starting point.

10 July 2007

Dirk Eddelbuettel: Announcing CRANberries

Earlier today I sent an announcement to the r-packages list. It describes CRANberries, two simple RSS feeds that summarize both 'new' and 'updated' packages at CRAN, the archive network for R. I cooked this up rather quickly using a few lines of R, a small SQLite db backend and the old Blosxom blog engine. A tip of the hat to Barry Rowlingson who almost immediately suggested to use the lol format instead. The hope is that this proves helpful for keeping tabs on the amazing growth of CRAN (which is now at over one thousand packages) as well as the number of updates to existing packages. The feed(s) can be consumed standalone, or via the brand new Planet R aggregator that Elijah announced today too.

3 July 2007

Dirk Eddelbuettel: More on 'nicer charts'

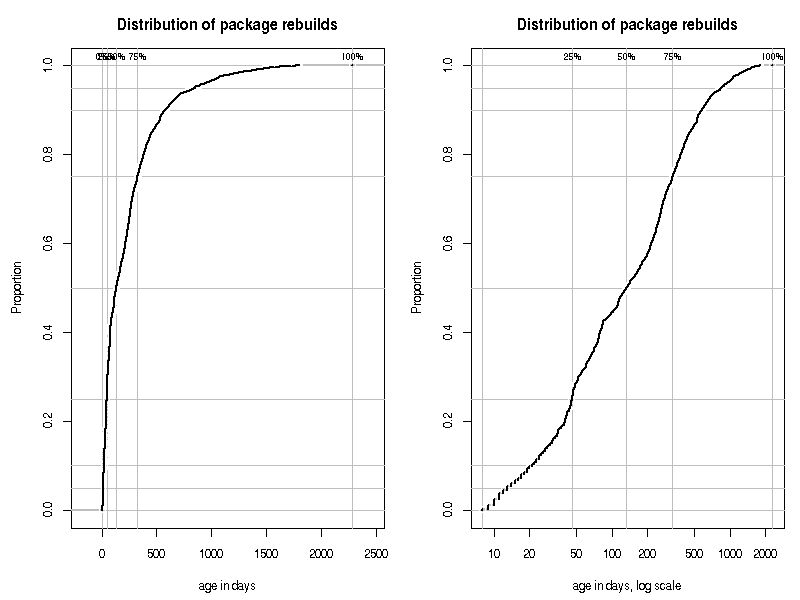
Via the Planet Debian aggregator and his blog, Sven followed up on my post regarding Lucas' plot of the package age distribution. As some of my points didn't seem to make it across, I will reiterate them more plainly: Sven also addresses the fact that what we really want is to see the quantiles of the data set. Quite right, and taking logs makes that easier. Consider the two charts below which plot the 'package age in days' as an empirical cumulative distribution function using built-in R functions ecdf and plot.stepfun (rather than redoing it ad-hoc as I had done), and also add explicitly quantiles. The two charts use the exact same instructions; however the second chart transforms the x-axis to a logarithmic scale. Debian Package Age-since-recompile Distributions charted two ways While it is close to impossible to find the 25 or 50 percentile on the first chart, it becomes a lot easier on the second chart because the x-axis is 'stretched' using the log transform. About one quarters of the distribution appears to be rebuild within 1.5 months old, and about half is younger than four months (as a quick call to summary(pkgAge) confirms). Reading these proprtions off the original chart, or the non-log chart, is much more difficult.

2 July 2007

Sven Mueller: Improving graphs

In Improving simple charts, Dirk Eddelbuettel wrote a nice little summary how to produce “nicer” charts using R. However, in my opinion, the charts he provided as alternate options to the original, purely linear graph are less readable for the average person. If anything, using a logarithmic scale on the original Y axis (number of packages not built after a specific date) would be of use, but the other graphs only hide the original point of the post Dirk replied to (How old are our (Debian’s) packages?). The point was that 94% of all packages had been rebuilt since the release of Sarge or, if you want to put it the other way around, 1264 (6%) were built before Sarge was released. This relationship is hidden from immediate recognition by the reader of the graphs. I admit though, that Dirk’s second graph (Number of packages against age in days with the age being on y logarithmic scale) is also insightful. The other two graphs he presents might make sense in a scientific publication if some point in the “more detailed” areas of the graph needs proving, but for this specific problem, they really don’t make sense to me. Actually, I would question their use even in scientific publications, since they distort the original data a lot. Scientists are pretty much used to logarithmic scales these days, but I couldn’t work out how the scales work on those two graphs. And another note on the second graph (logarithmic age): The way the X axis is labeled (10, 20, 50, 100,..) is also pretty non-intuitive to me. I’m much more used to something like 5, 10, 20, 40, 80, 160 and so on, which gives the same distance between each label and seems a lot more usable to me.. (edit: Fix spelling of Dirk’s surname)

30 June 2007

Dirk Eddelbuettel: Improving simple charts

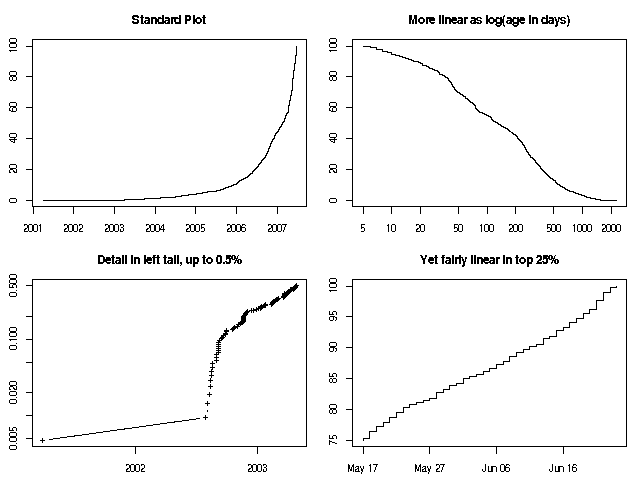
Earlier today and via Planet Debian, Lucas blogged about the 'age distribution' of Debian packages, defined as the time since the last (re-)compilation. He illustrated his findings with an, umm, rather ugly chart. Having climbed onto the soap box once before, I would like to point out how easy it can be to create simple, informative, and, at to least to me, prettier charts using R. Lucas included a URL to the data. The first nice thing to note that we can read the data directly from the URL -- no need to copy the file:
pkgAge <- read.table(file="http://people.debian.org/~lucas/arch-age/arch-age.log", col.names=c("pkg","yyyymmdd"))
read the data into a data.frame which we have given two column names.
pkgAge[,"date"] <- as.Date(as.character(pkgAge[,"yyyymmdd"]), "%Y%m%d")
pkgAge[,"age"] <- as.numeric(difftime(Sys.Date(), pkgAge[,"date"], units="day"))
pkgAge[,"prop"] <- (1:nrow(pkgAge)) / nrow(pkgAge) * 100
We then create three new columns. First is a date, by parsing the (integer) dates (after first casting them into characters) by supplying the format in standard C notation: "%Y%m%d" for year, date and month without any separators or formatters. Now, having the date as an actual date object inside a real data analysis language we can do things as e.g. computing date differences. The difftime function does just that, using the current date as other point. We ask for the return to be in days, and cast this down to a purely numeric vector (instead of datediff object). Lastly, we quickly compute the date proportion in percentages. We can then view the date. Before we plot,
png("packageAges.png", quality=100, width=640, height=480, pointsize=10)
oldpar <- par(mfrow=c(2,2), mar=c(2.5,2.5,3,1))
we direct the charts to a png file of given dimensions, and ask for all plots in one figure (using mfrow with two rows by two) with somewhat smaller figure margins using the mar argument to par. The first chart shows again proportion over date:
with(pkgAge, plot(date, prop, type='l', main="Standard Plot"))
(The with() function simply allows us to refer to the columns by their names without explicit subsetting. plot(pkgAge[,"date",], pkgAge[,"prop"]) is equivalent, but more cumbersome.) As it clear that the data has a fairly long tail in the older dates, we can also try to plot the plot over logarithmic time differences. This doesn't work for dates, but it works for our (positive-valued) age variable:
with(pkgAge, plot(age, prop, type='l', log="x", main="More linear as log(age in days)"))
The very far left tail below 0.5 percent is interesting as the one very old package is clearly an outlier within an outlier region. We use the subset function to take just one portion of the data, use logs, and explicit plotting symbols '+' in a points-and-lines plot:
with(subset(pkgAge, prop0.5), plot(date, prop, type='b', log="y", pch="+", main="Detail in left tail, up to 0.5%"))
Lastly, the upper quartile is fairly linear.
with(subset(pkgAge, prop>75), plot(date, prop, type='l', pch=".", main="Yet fairly linear in top 25%"))
At the end
oldpar <- par(mfrow=c(2,3))
dev.off()
we restore the graphics paramters and close the device (here the file). All this then yields the following chart: Debian Package Age-since-recompile Distributions Updated to correctly display the assignment operator <-
24 June 2007

Dirk Eddelbuettel: New OpenMPI packages

Debian had OpenMPI package since early last year when Florian Ragwitz made some initial stabs at packaging. The package has seen a number of NMU and patches since then, but was generally getting cobwebs ... which was too bad because OpenMPI seems to have some wind behind its sails upstream. Unfortunately, little of that got packaged for Debian. After some discussions on and around the debian-science list, a new maintainer group was formed on Alioth under the pkg-openmpi name. Tilman Koschnick (who had already helped Florian with patches), Manuel Prinz, Sylvestre Ledru and myself have gotten things in good enough shape in reasonably short time. And I have just uploaded a lintian-clean package set openmpi_1.2.3-0 to Debian, where it is expected to sit in the NEW queue for a little bit before moving on to the archive proper. The changelog entry (which will appear here eventually) shows twelve bugs closed. Our plan is to provide a stable and well maintained MPI implementation for Debian. OpenMPI is the designated successor to LAM, and apart from MPICH2, everybody seems to have thrown their weight behind OpenMPI. So we will try to work with the other MPI maintainers to come up with sensible setups, alternatives priorities and the likes. If you are interested in MPI and would like to help, come join us at the Alioth project pkg-openmpi. Last but not least, thanks to Florian for the initial packaging, and to Clint Adams, Mark Hymers, Andreas Barth, and Steve Langasek (twice even) for NMUs.

Next.

Previous.